Innovative, Objective, Practical



Date: July 20, 2025
In the first half of 2025, China faced growing external turbulence alongside interwoven domestic challenges. Despite these pressures, the economy demonstrated overall stability and continued progress in high-quality development. Tariff tensions eased following May’s negotiations in Switzerland, reducing potential impacts on export sectors. Coupled with domestic policy support, economic activity showed signs of recovery, though challenges persisted. Moving forward, policy implementation acceleration is needed to enhance multiplier effects, while domestic demand to be expanded by leveraging people’s aspirations for a better life.
The Economy Operated with Overall Stability.
In H1 2025, GDP grew 5.3% y/y at constant prices, 5.4% in Q1 and 5.2% in Q2. Value-added output rose across primary, secondary, and tertiary industries in Q2. Service industry remained a key growth engine, expanding 5.5% y/y in H1, with information transmission, software, and IT services leading at 11.1% growth. June’s Manufacturing Production Index and New Orders Index both increased m/m, signaling accelerated output and improved demand.
Tariff Tensions Disrupted Export Trends.
H1 goods exports rose 7.2% y/y in RMB terms, up 0.3 pp from Q1 and exceeding 2024’s performance, mostly due to 2024’s low base and tariff war effects. Following May’s Sino-U.S. tariff reductions, the y/y decline in U.S.-bound exports narrowed from -34.5% in May to -16.1% in June. Meanwhile, China maintained robust export growth to re-export hubs in June. Exports to ASEAN and Hong Kong SAR accelerated m/m. With pent-up U.S. orders fulfilled and given increased scrutiny of re-exports in U.S. trade agreements, future exports could face pressure.
Industrial Output Growth Accelerated Y/Y.
H1 industrial value-added for enterprises above the designated size rose 6.4% y/y, 0.6 pp higher than full-year 2024. Q1 and Q2 saw 6.5% and 6.3% growth respectively. Key drivers included: expanded large-scale equipment upgrade and consumer goods trade-in programs releasing domestic demand; and digital, smart and green transition in industrial development, notably digital product manufacturing went up 9.9% y/y, outpacing industrial averages for 23 straight months.
Investment Growth Decelerated Y/Y.
H1 fixed-asset investment grew 2.8% y/y, down 0.9 pp Jan–May. By sector, infrastructure went up 4.6% y/y (down 1.0 pp Jan–May), manufacturing up 7.5% y/y (down 1.0 pp Jan–May), real estate down 11.2% y/y (down 0.5 pp Jan–May) reflecting persistent stabilization pressures. While large-scale equipment upgrade and consumer goods trade-in programs continued to drive strong growth in high-end, smart, and green manufacturing, investment growth slowed post-acceleration across all three sectors.
Trade-in Policy Accelerates Consumption.
Driven by a series of policies aimed at promoting consumption, domestic demand continued to increase. H1 retail sales rose 5.0% y/y, up 0.4 pp from Q1 and continuing quarterly acceleration since Q3 2024. June sales grew 4.8% y/y, down 1.6 pp m/m. The implementation and optimization of consumer goods trade-in program boosted goods and services consumption, demonstrating strong momentum. H1 service retail picked up pace and rose 5.3% y/y, up 0.3 pp compared to Q1. Policy sustainability and consumption impacts warrant monitoring.
Pushing Prices Toward Higher Levels.
H1 CPI averaged -0.1% y/y, unchanged from Q1. Monthly volatility stemmed from Chinese New Year timing seen in CPI increased 0.5% in January, then decreased 0.7% in February. March–May CPI decline narrowed to -0.1%, before turning positive in June (up 0.1% y/y) due to international commodity price fluctuations and domestic consumer demand stimulus policies. The narrowing decline in food prices and the expanding growth in service prices are the main contributors to Q2’s improvement. H1 PPI fell 2.8% y/y, continuing its downward trend pressured by seasonal drops in prices across certain domestic raw material manufacturing industries, lower energy prices driven by increased solar, wind and hydropower generation, and price pressures faced by some export-led sectors.
Image source: IE Insights (2022). https://www.ie.edu/insights/articles/our-urban-life-in-2022/


Date: March 20, 2025
Following the Spring Festival, economy regained momentum in February as businesses resumed operations, accelerating production and commercial activity. Key indicators such as the Manufacturing Purchasing Managers’ Index (PMI), Non-Manufacturing Business Activity Index, and Composite PMI Output Index all rebounded month-on-month, remaining in expansionary territory. While these figures signal a tentative recovery from earlier lows, sustaining growth will demand stronger policy reinforcement and expedited implementation.
Economic Recovery Shows Marginal Improvement from Low Levels
In February, the Composite PMI Output Index rose by 1.0 percentage points from the previous month to 51.1%, returning to expansion territory. The Manufacturing PMI, up 1.1 percentage points to 50.2%, emerged as the primary growth driver. A breakdown of the index shows that both production and demand within the manufacturing sector improved, with the Production Index and New Orders Index rising by 2.7 and 1.9 percentage points, respectively, to 52.5% and 51.1%. Both indices entered expansion territory, indicating a notable improvement in manufacturing supply and demand. This resurgence bolstered corporate confidence, pushing the Purchasing Volume Index up by 2.9 percentage points to 52.1%. On the non-manufacturing side, the Non-Manufacturing Business Activity Index edged up 0.2 percentage points to 50.4% in February.
Export Disruptions Due to Tariffs and "Front-Loading"
From January to February, Merchandise exports grew 3.4% year-on-year, though this was a slight moderation compared to full-year 2024 and December figures. Trade with the U.S. expanded at a slower pace, with exports rising 2.9% year-on-year—5.1 percentage points lower than in December 2024—partly reflecting adjustments to U.S. tariff hikes. Meanwhile, shipments of products that retain a competitive edge under current tariff conditions, such as smartphones and laptops, saw a boost, possibly as exporters sought to stay ahead of potential U.S. trade restrictions. However, taking into account two fewer working days in January-February 2025 compared to the same period in 2024, the year-on-year export growth rate would have been higher if measured on a per-working-day basis.
New Growth Drivers Accelerate Industrial Expansion
Industrial output from large-scale enterprises grew 5.9% year-on-year in January-February, extending the robust momentum seen since Q4 2024. The pace edged up 0.2 and 0.1 percentage points from the fourth quarter and full year of 2024, respectively. Externally, export momentum sustained industrial expansion, with export delivery values rising 6.2% year-on-year—1.1 percentage points faster than 2024’s annual rate. Domestically, policies such as large-scale equipment upgrades and consumer trade-in programs, expanded in 2025, spurred industrial modernization and unlocked consumption potential, further driving growth. On the supply side, equipment manufacturing and high-tech industries led the charge, with rapid growth continuing to optimize the industrial structure.
"Two Major" Projects Fuel Investment Growth
In January and February, investment increased by 4.1% year-on-year, up by 0.9 percentage points compared to the whole of last year. First, support for "Two Major" projects (advancing national strategic initiatives and enhancing key security capabilities) has strengthened, with physical work volumes picking up, driving a faster growth in infrastructure investment. Infrastructure investment rose by 5.6% year-on-year in January and February, accelerating by 1.2 percentage points from 2024, contributing 1.1 percentage points to overall investment growth. The "Two New" policies (promoting large-scale equipment upgrades and consumer goods trade-ins) have been further expanded, with their effects becoming increasingly evident, spurring rapid growth in equipment investment. Second, progress in the high-quality development of key industrial chains is solid, with the transformation of traditional industries accelerating, leading to strong growth in manufacturing investment. Third, real estate policies have mitigated the decline in investment, showing early signs of stabilization.
Trade-In Programs and Green Consumption Boost Retail Sales
In January and February, retail sales grew by 4.0% year-on-year, with goods retail increasing by 3.9% and catering revenue rising by 4.3%. The growth in consumer spending was driven by the expansion of trade-in policies, which quickly unlocked demand for appliances and electronics. Meanwhile, the increasing focus on green and health-conscious products fueled strong growth in the eco-friendly and wellness sectors. Additionally, a surge in travel and leisure activities led to a rapid increase in spending on transportation, accommodation, and related services, highlighting a broader recovery in consumption.
Efforts Needed to Stimulate a Balanced Price Recovery
In February, China’s Consumer Price Index (CPI) fell 0.2% month-on-month and 0.7% year-on-year, reflecting the combined impact of Chinese New Year timing, holiday effects, and volatile global commodity prices. The year-on-year decline was primarily driven by a high base effect: food and service prices surged during February 2024’s holiday period, inflating the comparison base and putting downward pressure on this year’s figure. Food prices dropped 3.3% year-on-year, accounting for over 80% of the CPI decline (contributing 0.6 percentage points to the total 0.7% drop). This sharp contraction in food costs—the largest drag on prices—tipped the CPI into deflationary territory. Meanwhile, the Producer Price Index (PPI) continued to decline due to seasonal industrial sluggishness and softer global commodity prices. However, both month-on-month and year-on-year PPI decreases narrowed by 0.1 percentage points, signaling easing deflationary pressures.


Date: Feb 20, 2025
In January, due to the Spring Festival holiday and seasonal factors, industrial production entered an off-season, with the Producer Price Index (PPI) declining month-on-month. However, service and food prices rose significantly affected by the timing of the holiday, along with a rebound in gasoline prices, collectively driving an expansion in the Consumer Price Index (CPI) year-on-year growth. Overall, despite signs of moderation, economic activity remains on a positive trajectory, underscoring the need to expedite the implementation of supportive measures
Economic Growth Moderates, but Certain Sectors Gain Momentum
In January, the Composite Purchasing Managers’ Index fell by 2.1 percentage points month-on-month to 50.1%, reflecting impacts from the Spring Festival holiday and the return of employees to their hometowns. This indicates a broad-based slowdown, though overall economic expansion persists. Driven by the Spring Festival effect, sectors related to residents' travel and consumption—such as road transportation, accommodation, catering, ecological protection, and public facility management—saw their Business Activity Indexes rebound into expansionary territory, signaling greater market vitality. Meanwhile, sectors including air transport, postal services, telecommunications, broadcasting, satellite transmission, and monetary financial services maintained robust Business Activity Indexes above 55.0%, sustaining rapid growth in output.
Surge in Aggregate Social Financing
In January, total social financing increased by 7.06 trillion yuan, up by 586.6 billion yuan compared to the same period last year. Financial institutions issued 5.13 trillion yuan in new RMB loans (including loans to non-bank financial institutions), a year-on-year increase of 210 billion yuan. Structurally, the surge was driven by government bonds and corporate financing, while household borrowing remained weak. Corporate financing hit record highs, with medium- and long-term loans growing further despite a high base. The demand for household short-term loans remained low, likely due to the timing of the Spring Festival. Additionally, the reduced demand for business loans to refinance existing mortgages, following cuts in mortgage rates, weighed on medium- to long-term business loans.
Property Market Prices See Divergent Trends
In January, housing prices in first-tier cities continued to rise month-on-month, whereas second- and third-tier cities saw slight declines, reflecting a clear divergence in trends. Specifically, new home prices in first-tier cities increased by 0.1% month-on-month, though the rate of growth slowed by 0.1 percentage point compared to December. In second-tier cities, new home prices rose by 0.1%, marking the first increase since June 2023, while third-tier cities saw a 0.2% decline. For existing homes, first-tier prices edged up by 0.1%, a 0.2 percentage point slowdown from December, second-tier prices dropped by 0.3%, and third-tier prices fell by 0.4%. Year-on-year, price declines narrowed across all city tiers, suggesting gradual stabilization.
Core Consumption Recovery Emerges as Economic Stabilizer
In January, industrial production remained subdued due to the holiday, with the PPI falling by 0.2% month-on-month and 2.3% year-on-year—unchanged from the previous month's annual decline. Prices in non-ferrous metal mining and processing saw significant increases, while ferrous metal smelting, coal mining, and related industries accounted for nearly 90% of the PPI’s annual decline, contributing 2.11 percentage points. The CPI, however, expanded year-on-year, fueled by holiday-driven service and food price surges along with higher gasoline prices. Notably, the core CPI (excluding food and energy) rose for the fourth consecutive month, climbing 0.5% month-on-month and 0.6% year-on-year, with both growth rates accelerating from December.


Date: Jan 20, 2025
Despite external pressures and domestic challenges, China's economy exhibited stability and steady progress in 2024. Targeted incremental policies boosted confidence and facilitated a strong recovery. Export growth decelerated in the first three quarters owing to diminished global demand, although industrial supply chains remained resilient. In Q4, an increase in "front-loading exports" stimulated manufacturing growth, whereas large-scale equipment upgrades and consumer goods trade-in programs maintained ongoing demand and investment in manufacturing. Existing policies, together with new stimulus measures, have spurred local infrastructure investment, though further improvements are required. The recovery in the real estate sector remains sluggish, and its economic contribution has not yet improved.
Overall Economic Stability with Continued Growth.
In 2024, China’s GDP increased by 5.0% at constant prices, with quarterly growth rates of 5.3% in Q1, 4.7% in Q2, 4.6% in Q3, and 5.4% in Q4, indicating a stable upward trend. From Q4 onwards, sustained policy impacts significantly enhanced market expectations and confidence, resulting in positive shifts in both the capital and real estate markets. The service sector grew by 5.8% year-on-year in Q4, an increase of 1.0 percentage point from Q3. The stock market surged, with trading volumes in the Shanghai and Shenzhen markets rising by 126.4% and 124.4% year-on-year respectively, significantly outperforming the first three quarters.
Exports See Consistent Growth.
In 2024, China’s goods exports increased by 7.1%, indicating a rise of 6.5 percentage points from the previous year, significantly contributing to economic growth. In Q4, "front-loading exports" surged, and strong consumption demand in Europe and the U.S. stimulated a resurgence in export growth. In December, exports rose 10.9% year-on-year, representing an increase of 4.0 percentage points from the previous month. The U.S. remained the primary driver of growth, whereas exports to ASEAN increased by 18.9%. Products sensitive to U.S. tariffs, such as automobiles, machinery, auto parts, and textile yarns, saw notable growth. Furthermore, Chinese industrial goods gained global competitiveness, further accelerating export growth.
Manufacturing Fuels Industry Resilience.
In 2024, China’s large-scale industrial enterprises exhibited stable growth, with value-added industrial output rising by 5.8% year-on-year, reflecting a 1.2 percentage point acceleration from the previous year. Manufacturing played a central role, rising by 6.1%, whereas mining and utilities grew by 3.1% and 5.3%, respectively. Policy support continued to advance the manufacturing sector toward higher-end development, with equipment manufacturing increasing by 7.7% and high-tech manufacturing by 8.9%, both exceeding overall industrial growth.
Investment Growth Accelerates with Policy Support.
Fixed asset investment increased by 3.2% in 2024, up 0.2 percentage points over the previous year. Backed by ultra-long-term special government bonds and local government special bonds, major infrastructure projects advanced rapidly, boosting infrastructure investment by 4.4%. Manufacturing investment increased by 9.2%, indicating the sector’s shift toward high-end and advanced industries. Investment in high-tech manufacturing and services grew by 7.0% and 10.2%, respectively. In Q4, targeted policy measures contributed to the stabilization of the real estate market, easing the decline in new home sales and driving the growth in the real estate production index for three consecutive months.
Consumption Growth Requires Further Stimulus.
In 2024, retail sales of consumer goods increased by 3.5%, accelerating in Q3 and Q4, but still below the previous year’s pace. Retail sales of goods rose by 3.2%, whereas dining revenue increased by 5.3%, both below the previous year’s growth rates. Sales at large brick-and-mortar retailers rose by 1.9%, with new retail formats performing well. Policies promoting trade-ins for consumer goods resulted in stronger sales in key categories, including home appliances and audiovisual equipment, which maintained double-digit growth for four consecutive months. Auto and furniture sales returned to positive growth, whereas demand for construction and home improvement materials showed signs of recovery.
Stabilizing Prices and Easing Declines.
In 2024, the Producer Price Index (PPI) decreased by 2.2% year-on-year, narrowing its decline by 0.8 percentage points compared to the previous year. From January to July, the PPI decreased from -2.5% in January to -0.8% in July, driven by rising international crude oil and non-ferrous metal prices, a recovering domestic production sector, and a low base effect. However, in August, a dip in global commodity prices led to a 0.7% month-on-month loss, widening its year-on-year decline. Since September, the impact of policy measures and recovering industrial demand has slowed the PPI's monthly decline, with the index turning positive in November and the year-on-year decrease steadily shrinking.
Date: December 20, 2024
In November, the combined effects of macroeconomic policies became more evident. The acceleration of export growth boosted industrial chains, while policies promoting large-scale equipment upgrades and consumer goods trade-ins bolstered manufacturing demand and investment. Infrastructure investment, though slightly decelerating, demonstrated resilience due to the effective execution of existing policies and the accelerated implementation of new measures. Concurrently, strengthened real estate support policies increased transaction volumes; nonetheless, achieving full stabilization requires further recovery in income expectations on the demand side. On the whole, macroeconomic policies are yielding tangible benefits, with key sectors exhibiting promising signs of recovery.
Economic Expansion Gains Further Momentum
In November, the Composite PMI Output Index remained steady at 50.8%, indicating sustained economic growth. The Manufacturing PMI increased to 50.3%, with the Production Index and New Orders Index rising to 52.4% and 50.8%, respectively. Notably, new orders returned to growth for the first time since May, indicating increased demand and market activity. However, the non-manufacturing sector saw mounting pressure as the Business Activity Index dipped to 50.0%. Service output growth moderated slightly to 6.1% year-on-year, down 0.2 percentage points from October.
Exports Remain Stable Amid Fluctuations
From January to November, goods exports increased by 6.7% year-on-year, aligning with the January–October growth rate, indicating strong overall resilience. While November's growth rate decreased by 6 percentage points to 6.7%, it remained among the highest levels this year. Key drivers were front-loading effects and sustained strong demand from the U.S. and ASEAN markets, with U.S. exports surpassing those to Europe. Holiday demand for toys and communication equipment notably enhanced U.S. export growth. However, the EU’s tariffs on electric vehicles tempered gains in the automotive supply chain.
Manufacturing Drives Steady Industrial Growth
From January to November, large-scale industrial output increased 5.8% year-on-year, with November seeing an acceleration of 5.4%. Manufacturing increased by 6.0%, marking its third consecutive month of growth and solidifying its position as the primary driver. Conversely, mining and utilities experienced a slight slowdown from the previous month. Policies promoting new technologies and emerging industries stimulated rapid growth in shipbuilding, smart consumer devices, and lithium battery production. Incentives for new energy vehicles and home appliance upgrades further boosted output. In November, export delivery value increased 7.4% year-on-year, representing the highest monthly growth since August 2022 and providing a strong boost to industrial chains.
Investment Growth Eases Slightly Despite Policy Support
Investment increased 3.3% year-on-year from January to November, with monthly growth decelerating to 2.4% in November. Infrastructure investment slightly decelerated to 4.2%, whereas manufacturing investment maintained a strong pace of 9.3%. Real estate investment declined further to -11.5%, but property sales recorded positive monthly growth for the first time since April 2023, increasing developers' funding sources. Transportation and storage investment declined sharply, whereas gains in power and water infrastructure provided significant support.
Multiple Measures to Bolster and Sustain Consumption Growth
Consumption continued to recover steadily as policies such as trade-ins for new products further stimulated consumer demand, resulting in strong sales across most categories. From January to November, retail sales increased 3.5% year-on-year, maintaining the same pace as the previous period. In November, retail sales grew 3.0%, seeing a slight moderation attributed to early "Double 11" promotions and a strong comparison base from last year. Policies promoting product upgrades led to significant growth in auto and furniture sales, which increased by 6.6% and 10.5%, respectively. Construction and renovation materials saw a resurgence, recording a 2.9% increase. Service-related retail sales also sustained a robust upward trend under the influence of various consumption-boosting measures.
Domestic Prices Gradually Return to Stable Levels
In November, coordinated policies boosted industrial recovery, resulting in a shift in the Producer Price Index from decline to slight monthly growth, reducing its year-on-year shrinkage by 0.4 percentage points. Prices in key sectors, including petroleum extraction, chemicals, and electricity, experienced minor reductions. On the Consumer Price Index (CPI) front, food prices dropped 2.7% month-on-month, markedly above the seasonal average decline over the past decade, mainly attributable to abnormal weather that enhanced agricultural production and logistics. This resulted in a month-on-month decrease of 0.6% in the overall CPI. Non-food prices also fell by 0.1%, indicating weaker demand for travel during the off-season. The decrease in food prices contributed to a moderation in the year-on-year CPI increase, which eased to 1.0%.


Date: Nov 20, 2024
In October, the economy experienced a broad-based recovery from the previous month's lows. This improvement was supported by the latest round of macro policies and a favorable shift in export dynamics. Export growth surged due to timing discrepancies, which, in turn, energized the export-linked industries. The push for equipment upgrades and consumer goods trade-ins buoyed manufacturing demand and investment. Infrastructure investment gained momentum as existing policies took effect and new ones accelerated. Real estate saw a lift in transaction volume due to supportive policies, but a sustained recovery will require improving consumer income expectations. To sum up, policymaking is about trade-offs; fiscal expansion is often more effective than monetary expansion in combating economic downturns. It's imperative to swiftly address the bottlenecks in policy implementation and loosen the reins on individuals to boost the economy.
The economy shows a comprehensive improvement from its recent lows. Key economic activity indicators rose in October compared to September. The manufacturing PMI, non-manufacturing business activity index, and the composite PMI output index increased to 50.1%, 50.2%, and 50.8%, respectively, signaling a broad-based economic upturn. All five major sub-indices for the manufacturing sector increased, and the service sector's business activity index ticked up by 0.2 percentage points to 50.1%, propelling the non-manufacturing business activity index higher. Service production surged 6.3% year-on-year, a yearly peak. A stock market trading boom in October drove the financial sector's production index up by 3.7 points to 10.2%, its highest level this year and a key growth driver. This also contributed to a 5.0% year-on-year increase in the national service sector production index for the January–October period.
Shipping schedule shifts spurred faster export growth. The export growth rate for October surged by 9.6 percentage points to 11.2% compared to September. This momentum propelled the year-to-date export growth rate to 6.7% through the month. Bucking the trend of a typical October lull, this year brought a noteworthy 1.8% increase in exports from the previous month, primarily attributed to typhoon disruptions that postponed some of September's exports to October, resulting in an unexpected year-on-year growth. On a country-specific basis, the export growth rates to major destinations rebounded.
Exports and policies keep industrial growth steady. From January to October, the value-added output of industrial enterprises above designated size rose by 5.8% year-on-year, unchanged from the first nine months. The manufacturing and mining sectors saw a pickup in production, while the utilities sector's growth eased to 5.4%. A resurgence in domestic demand improved the sales-to-production ratio, while the value of exports rose by 3.7% year-on-year. Policies on equipment renewal and consumer goods took effect: car production swung from negative to positive, and the output of new energy vehicles reached a record high. Production of charging piles surged by 25.2%, and industries such as smart consumer devices, shipbuilding, and battery manufacturing have shown substantial value-added growth. The production volumes of agricultural processing, excavating machinery, packaging equipment, and home electric heating appliances have all sustained double-digit growth rates.
Policy efforts keep investment growth on an even keel. From January to October, investment climbed 3.4% year-on-year, matching the pace set during the first nine months. The monthly manufacturing investment growth rate hit 9.9% thanks to large-scale equipment renewals, innovation, and industrial upgrading. Industry-wise, investment accelerated in sectors such as other transportation equipment, non-ferrous metals, food manufacturing, and chemicals. Infrastructure investment also accelerated year-on-year to 4.3%, the first increase since March. The real estate market experienced increased transaction activity, with the year-on-year decline in new commercial housing sales area and sales volume for January to October easing by 1.3 and 1.8 percentage points, respectively, compared to the January–September period. However, such improvement has not yet fed into increased investment.
Policies gave a marginal boost to consumption growth. In October, programs such as consumer goods trade-ins and the "Double 11" shopping spree fueled the year-on-year growth in retail sales, which climbed to 4.8%, up from September. Commodity retail sales growth reached 5%, driven by accelerated sales in home appliances, audio-visual equipment, cultural and office supplies, furniture, and automobiles at retail units above a certain threshold. Necessity consumption remained stable, and discretionary consumption showed modest gains. Auto retail experienced significant recovery, and the real estate chain surged, with the decline in retail sales of building and decoration materials narrowing. As a series of stimulus policies are gradually implemented and service supply is optimized, combined with holiday buzz, service spending is on a fast track.
Active regulation is steering prices towards stability. International crude oil prices dipped due to geopolitical factors, which, in turn, lowered prices in China's oil-related industries. Nevertheless, new policies appear to have revived demand for certain industrial goods, helping to curb the Producer Price Index's (PPI) monthly slide, which shrank by 0.5 percentage points month-on-month. Equipment manufacturing saw price drops due to global economic shifts and domestic sales promotion, slightly widening the PPI's year-on-year decline by 0.1 percentage point. Consumer Price Index (CPI) gains were modest in October, ticking up 0.3% year-on-year, a sign of stable prices overall. Non-food prices declined further by 0.1 percentage points, reflecting market dynamics, while food prices eased back to a 2.9% gain but continued trending upward.
Date: October 20, 2024
During the first three quarters of 2024, a slowdown in overseas demand and increasing uncertainties contributed to a deceleration in year-on-year export growth compared to the first half of the year. Nonetheless, exports continued to drive the development of related industries within the industrial supply chain. The demand and investment in manufacturing were bolstered by policies encouraging large-scale equipment renewals and consumer trade-ins for new products. Additionally, the pace of implementation of infrastructure project reserves increased. Despite existing challenges, China's economic growth rate of 4.8% during the first three quarters still ranks among the top globally. Yet, insufficient demand remains the most significant challenge. This is further exacerbated by the negative growth in public budget revenues and an increased decline in M1 money supply, together signaling a persistent negative economic spiral. To break this cycle and foster a refined economic structure, it is imperative to swiftly implement "macro-micro easing" policies.
Economic factors contributing to an upward economic trend are on the rise. In the first three quarters, the GDP grew by 4.8% year-on-year, a slight deceleration of 0.2 percentage points from the first half of the year. The GDP for the third quarter alone increased by 4.6% year-on-year, marking a 0.1 percentage point decrease from the second quarter. The primary, secondary, and tertiary sectors experienced year-on-year growth rates of 3.2%, 4.6%, and 4.8%, respectively. The manufacturing PMI rebounded to 49.8% in September, with the production index increasing above the critical point for the first time in a month. Concurrent with these trends, the Chinese economy has exhibited several positive developments during the first three quarters. These include the high-tech manufacturing sector consistently outpacing the overall industrial growth rate, a noteworthy pickup in the growth of the service industry, and a steadying growth rate among real estate development investments. These encouraging signs indicate an underlying resilience and dynamism within the economy, suggesting that it remains on a steady course despite broader economic challenges.
A multitude of factors influenced the growth rate of exports. In the first three quarters, exports increased by 6.2% year-on-year, a deceleration of 0.7 percentage points compared with the first half of the year. This trend continued into September, when exports only increased by 1.6% year-on-year, the smallest increase since February 2024. The ongoing decline in the global manufacturing PMI has had a ripple effect, decreasing new export orders to 47.5% in September. Additionally, the above-average number of intense typhoons has further disrupted export shipping activities, exacerbating this situation. Overseas uncertainties, including ongoing trade frictions and the unpredictability of the US election, coupled with negotiations with American dockworkers on the East Coast, have advanced the peak season's arrival. Furthermore, the EU's implementation of anti-subsidy tariffs has led to a cumulative 0.5 percentage point decrease in overall exports compared to the previous month.
Exports supported the stability of related industries. During the first three quarters, the output of industrial enterprises above the designated size increased by 5.8% year-on-year, a rate consistent with the January-August period. It then showed a slight deceleration of 0.2 percentage points from the first half of the year. Additionally, the manufacturing sector saw its growth ease to 6.0%. After four consecutive months of decline, the year-on-year growth rate for industrial enterprises above the designated size rebounded to 5.4% in September. The effect of exports on industrial growth is notable, with the export delivery value of industrial enterprises above the designated size increasing by 4.1% year-on-year during the first three quarters, showing an accelerating trend quarter by quarter. This has spurred significant double-digit year-on-year growth in the export delivery values for export-related manufacturing sectors, such as the automotive, metal products, railway, shipbuilding, aerospace, and aviation industries.
The foundation for an upward trend in investment requires further strengthening. During the first three quarters, the year-on-year growth of total investment was 3.4%, easing by 0.5 percentage points from the first half. Within this change, manufacturing investment saw a year-on-year increase to 9.2%, infrastructure investment slowed to 4.1%, and real estate development investment shrank by 10.1%. In September, investment rebounded with a year-on-year increase of 3.4%, with all three main categories showing higher growth rates than in the previous month, signaling a marginal improvement in investment momentum. Manufacturing investment for September rose by 9.7% year-on-year, with notable acceleration in the textile, general equipment, agricultural and sideline food products, and pharmaceutical manufacturing industries, increasing by 6.3, 7.4, 7.7, and 7.2 percentage points, respectively, compared to the previous month. The other transportation equipment sector saw a substantial year-on-year increase of 37.9%. Infrastructure investment, supported by intensified fiscal measures and faster policy implementation, showed a significant rebound, with all sectors posting higher year-on-year growth rates than in the previous month. The cumulative year-on-year growth of infrastructure investment, including electricity, increased by 1.4 percentage points compared to the previous month, indicating that power sector investment was a key driver in the infrastructure rebound.
Overall consumer spending growth has been weakening amidst fluctuations. Consumer spending growth has been fluctuating and generally weakening. For the first three quarters, the year-on-year increase in total retail sales was 3.3%, a 0.4 percentage point reduction from the first half of the year. In September, the growth rate of total retail sales increased to 3.2%, influenced by the effectiveness of trade-in policies and a low comparative base from the previous year. Commodity retail sales saw a year-on-year increase of 3.3%, with sales by larger retailers increasing by 2.8%, indicating a return to positive growth. Essential and discretionary consumer spending remained robust, while the real estate-related consumption chain saw a notable recovery. Localized efforts to enhance trade-in policies have boosted sales of automobiles, home appliances, and related products. However, service consumption showed signs of weakening. From January to September, the cumulative year-on-year growth rate of service retail sales slowed to 6.7% compared to the January–August period, and the year-on-year growth rate of catering income fell to 3.1% in September.
The Producer Price Index (PPI) is anticipated to decrease further in its year-on-year decline. For the first three quarters, the PPI decreased by 2.0% year-on-year, which is a slight improvement of 0.1 percentage points from the first half. In September alone, the PPI decreased by 2.8% year-on-year, a worsening of 1.0 percentage point from August. International factors have led to a slowdown in price increases for industries associated with oil and non-ferrous metals. The real estate market continues to adjust, and prices in related industries such as steel and cement have been weak. Meanwhile, the Consumer Price Index (CPI) for the first three quarters increased by 0.3% year-on-year, expanding by 0.2 percentage points from the first half. This was mainly due to increases in non-food prices. With additional policies pending and the gradual implementation of existing measures, the PPI's upward momentum is expected to regain strength. This could lead to further narrowing of the PPI's year-on-year decline, not only in October but also throughout the fourth quarter.


Date: August 20, 2024
Export growth recovered in August, and policy support bolstered manufacturing investment. However, growth in infrastructure investment and physical work volume were supressed. As real estate policies have been implemented, more measures are expected to boost market confidence. Consumer spending growth has slowed, with industrial and consumer goods prices remaining low. Public budget revenues and monthly consumption in top-tier cities fell, the decline in M1 money supply widened, and urban surveyed unemployment rates rose beyond seasonal patterns—all pointing to economic weakening compared to July. It is critical to resolve the issues at the next stage underlying the economic and non-economic mechanisms causing this slowdown, to balance growth speed and quality, and to emphasize the impact of the economic performance on public well-being and external cooperation.
Be vigilant against the economic downward spiral. In August, the composite PMI output index dropped by 0.1 percentage points to 50.1%, its lowest since January 2023, with the manufacturing PMI down 0.3 points, being the main drag. Key sub-indices, such as production and new orders, remained below critical levels and worsened than the previous months, indicating a worsening contraction cycle in manufacturing, characterized by "weakened new orders–reduced production–shrinking raw material inventories–weakening employment–and delayed deliveries." While the non-manufacturing business activity index saw a slight rise, driven by the services sector, other indicators remained generally sluggish.
Specific industries contributed to a rebound in export growth. Exports increased by 1.7 percentage points month-on-month in August, reaching 8.7%, the highest since March 2023. This was partly due to delayed shipments caused by typhoon disruptions in late July, which moved some goods initially scheduled for export in July into August. Additionally, the peak season for consumer electronics restocking and the launch of new products resulted in a rise in exports, further boosted by demand spurred by the application of AI. Consequently, smartphone exports climbed to 16.9%, contributing 0.6 percentage points to overall export growth.
Exports supported the stability of related industries. Although the year-on-year growth rate of industrial enterprises above the designated size dipped to 4.5% in August owing to a higher base of the same period last year, the two-year average growth accelerated to 4.5%. Among the three major categories, the manufacturing and mining industries saw decelerated growth, whereas the growth rate of electricity, thermal power, gas, and water production and supply industries accelerated to 6.8%. The mining sector’s slowdown indicates a deceleration in upstream inventory replenishment. Export-linked industries continued to perform well, with export deliveries in sectors such as automotive and general equipment maintaining double-digit growth.
Multiple factors continued to impede investment growth. From January to August, investment growth slowed by 0.2 percentage points to 3.4% compared to January–July, with total private investment plummeting to -0.2%. Breaking it down into three major categories: infrastructure investment growth slowed by 0.5 percentage points, manufacturing investment growth slowed by 0.2 percentage points, and real estate development investment maintained the same decline. Infrastructure was the main drag on the deceleration of investment growth, possibly due to extreme heat and rainfall disrupting construction activities as well as the slow implementation of funded projects. However, from January to August, investment in high-tech manufacturing was 0.5 percentage points higher than the overall manufacturing sector, driven by large-scale equipment renewals, which saw equipment purchase investments surge by 16.8%.
Consumption weakens as low base effects fade. In August, total retail sales of consumer goods increased by 2.1% year-on-year, down 0.6 points from the previous month. Commodity retail sales fell 1.9%, whereas summer travel helped boost catering revenues by 3.3%. However, slower residents' income growth resulted in weaker retail sales growth in both urban and rural areas.
More measures are required to stabilize prices. In August, affected by insufficient market demand and the downward trend in prices of several bulk commodities, production material prices in energy-intensive industries weakened, resulting in a month-on-month and year-on-year decline in the Producer Price Index (PPI). The expanding drop in PPI structurally dragged down the Consumer Price Index (CPI). However, disturbances such as high temperatures and rainy weather pushed the CPI up by 0.6% year-on-year, with food prices driving the increase. Among them, the rise in prices of fresh vegetables and fruits was the primary driver.


Date: August 20, 2024
In July, export growth slowed compared to the previous month amid global manufacturing volatility and increasing international uncertainties. Local infrastructure development remained sluggish, and the real estate sector continued to struggle. Although consumer spending saw a modest increase, its sustainability remains uncertain. Industrial product prices continued to fall and consumer prices stayed low. These challenges were further underscored by negative growth in public budget revenue, lower monthly consumption in first-tier cities, and a decrease in M1 money supply, signaling a broader downturn in economic prosperity. In response, it is essential to address the systemic adverse effects of sustained low prices, closely monitor shifts in micro-incentives, and swiftly enhance primary entity incentives to stimulate sustained economic recovery.
The foundation for economic recovery requires further strengthening.
Over the same period, the manufacturing PMI dipped to 49.4%, signaling ongoing contraction, while the non-manufacturing activity and composite PMI output indexes slipped to 50.2%, reflecting growth deceleration. In the manufacturing sector, the production index fell to 50.1%. The service industry also saw a decline, with the business activity index falling to 50.0%. However, in sectors closely related to travel and consumption, such as railway and air transport, the business activity index remained robust, staying above 55.0%. In contrast, the construction industry's business activity index declined to 51.2%.
External demand turbulence slowed export growth.
Global manufacturing shifts and rising international uncertainties dampened export growth in July compared to the previous month. Regionally, while exports to Europe and the US increased, shipments to ASEAN, South Korea, Japan, and other Asian economies declined. By category, technology-intensive goods outperformed labor-intensive goods. On one hand, a resurgence in global demand for consumer electronics boosted exports along the computer and electronics supply chain. On the other hand, waning demand related to international events like the Paris Olympics reduced labor-intensive product exports.
Exports supported the overall stability of the industrial sector.
In July, the added value of the industrial enterprises above designated size eased by 0.1 percentage points to 5.9% compared to the previous month. Overall, exports remained the primary growth driver, with the cumulative growth rate of export delivery values for these enterprises increasing monthly since the beginning of the year. In July, export delivery values grew by 6.4% year-on-year, surpassing June’s growth rate. The electronics sector, a major export industry, experienced accelerated year-on-year growth in export delivery value, providing significant support. The automotive industry also maintained double-digit export delivery value growth for eight consecutive months. Additionally, the general and specialized equipment and chemical industries reported double-digit growth in export delivery values, possibly due to front-loading exports.
Multiple factors slowed investment growth.
From January to July, investment grew by 3.6%, a decrease of 0.3 percentage points compared to the first half of the year. A closer look at the sectors reveals that investment in manufacturing, infrastructure, and real estate slowed relative to the first half of the year. Infrastructure investment growth fell to 4.9% year-on-year due to the slow issuance of new special bonds and challenges in local government financing. Despite supportive policies, few cities experienced a market rebound, with housing prices remaining sluggish and homebuyers adopting a strong wait-and-see attitude.
A low base led to a rebound in consumer spending growth.
Retail sales growth rebounded due to a lower base compared to the same period last year, as well as a boost from summer travel and consumption-boosting policies. In July, the year-on-year increase rose by 0.7 percentage points to 2.7% compared to June. However, declines in overall income and wealth led to a heightened saving preference among residents, keeping consumer spending growth for enterprises above the designated size sluggish, with a growth rate of only -0.1%. Amid the summer travel season, the potential for service consumption continued to be unleashed. From January to July, service retail sales grew by 7.2% year-on-year, outpacing the growth of goods retail sales during the same period.
The persistent decline in prices needs to be reversed promptly.
From January to July, the year-on-year decline in the Producer Price Index (PPI) narrowed by 0.1 percentage points from the first half of the year, reaching -2.0%. Insufficient market demand and falling prices for some international bulk commodities contributed to a continued decline in the July PPI, with both month-on-month and year-on-year growth figures falling at the same rate as the previous month. The main drivers of the PPI drop were falling prices in the ferrous metals, non-metals, and equipment manufacturing industries. On the Consumer Price Index (CPI) front, high temperatures and rainfall drove up the prices of fresh vegetables and eggs, while strong summer travel demand increased the cost of flights and accommodation. As a result, the CPI increased by 0.5% year-on-year in July, with pork prices surging by 20.4%, significantly contributing to the rise.


Date: Jul 20, 2024
In the first half of 2024, export growth accelerated due to global manufacturing recovery, and consumer goods sales remained steady thanks to supportive policies and other factors. However, the sustained decline in industrial product prices and the persistently low consumer prices suggest that demand remains relatively weak. The real estate market remains sluggish, overall societal expectations are still low, and businesses are under significant operational pressure. To turn the tide, it's crucial for policies to be significantly ramped up as soon as possible to improve expectations and boost confidence in the economy.
The economy showed signs of expansion, but faced mounting pressures.
In the first half of the year, the GDP increased by 5.0% year-on-year at constant prices, marking a slowdown from the same period last year and the entire previous year. The growth rate was 5.3% in the first quarter, but decelerated to 4.7% in the second quarter. The primary sector saw a year-on-year growth of 3.6% in the current quarter, while both the secondary and tertiary sectors experienced a noticeable decline. The swift slowdown in the growth rate of the tertiary sector's GDP could be attributed to adjustments in the statistical approach of the financial industry, reflecting the overall economic strain.
Recovery in external demand drives export acceleration.
In the first half of the year, exports grew by 6.9%, significantly outpacing the same period last year and the entire previous year. According to the latest statistics released by the WTO, the global manufacturing prosperity index continued to rise in the second quarter, and the trade-weighted manufacturing PMI rebounded. Influenced by the global trade recovery, exports in June registered a year-on-year increase of 8.6%, up 1 percentage point from the previous month, reaching the highest point since January 2024. The trade surplus in goods reached its highest since historical data began in August 1994. Despite a significant improvement in the volume of exports since the beginning of the year, the prices of exports have remained low.
Exports contributed to the overall stability of the industrial sector.
In the first half of the year, the added value of the industrial enterprises above designated size grew by 6.0% year-on-year, with the first and second quarters seeing respective increases of 6.1% and 5.9%. Among the three major sectors, manufacturing saw a robust growth of 6.5%, while the electricity, heat, gas, and water production and supply sector grew by 6.0%. The mining industry, however, experienced a more modest increase of 2.4%. Collectively, this indicates a slight overall deceleration in the growth rate. The high-tech manufacturing sector has been a standout, leading the way in high-end manufacturing. The added value of high-tech manufacturing industries above designated size surged by 8.7% year-on-year in the first half of the year, up by 1.2 percentage points compared to the first quarter. Driven by the rebound in exports, the cumulative growth rate of export delivery value for industrial enterprises above designated size has been accelerating month by month. This upward trajectory has been sustained for five consecutive quarters since the second quarter of 2023, underscoring the sector's resilience and growth momentum.
A variety of factors led to a continued decline in overall investment.
In the first half of the year, investment grew by 3.9% year-on-year, marking a slowdown from the first quarter but an acceleration compared to the same period last year and the entire previous year. From the perspective of three areas: Infrastructure investment rose by 5.4%, manufacturing investment by 9.5%, while real estate investment fell by 10.1%, with all these sectors seeing a decrease from the first quarter. Since the beginning of the year, regions have been proactive in initiating projects funded by additional government bonds and accelerating post-disaster reconstruction efforts. However, a slow fiscal tempo and the strain on fiscal spending have led to a continuous decline in narrowly defined overall infrastructure investment. The new real estate policies have started to take effect, with the year-on-year decrease in real estate investment narrowing for the first time this year.
The deceleration in the growth of consumer spending requires close attention.
In the first half of the year, China's total retail sales of consumer goods increased by 3.7% year-on-year, a slowdown compared to the first quarter, the same period last year, and the entire previous year. Among these, retail sales of goods rose by 3.2%, catering services saw a growth of 7.9%, and the retail sales of services were up by 7.5% year-on-year. Overall, the performance has weakened compared to the first quarter.
The persistent decline in prices needs to be reversed promptly.
In the first half of the year, the Producer Price Index (PPI) fell by 2.1% year-on-year, marking a 0.6 percentage point decrease in the rate of decline compared to the first quarter. The overall upward trend in international prices for crude oil and non-ferrous metals has led to increased prices in related domestic industries. Prices in sectors such as coal, building materials, and equipment manufacturing have seen a reduction in the rate of decline. Policies including large-scale equipment renewal and trade-ins of old consumer goods for new ones are gradually being implemented and are beginning to take effect, contributing an improved outlook for the steel market. The slowing decrease in PPI is contributing to a recovery in the Consumer Price Index (CPI), but the ongoing negative growth in PPI continues to exert downward pressure on the CPI. There has been a slight decline in the growth rate for service prices: in the first half of the year, service prices were up by 0.9% year-on-year, with the growth rate falling by 0.2 percentage points from the first quarter.


Date: Apr 20, 2024
In the first quarter of 2024, the economy improved overall due to the combined effect of recovering external demand, the sustained impact of earlier policies, the timing of the Spring Festival, and changes in base figures. Major macroeconomic indicators remained generally stable, but data for March showed signs of marginal weakening compared to January and February. This weakening is partly due to the base effect but also requires close attention, indicating the need for sustained policy efforts.
Policies, among other factors, have contributed to the overall economic improvement. In the first quarter, GDP grew by 5.3% year-on-year at constant prices, accelerating compared to both the fourth quarter and the entire previous year. The secondary industry played a significant role in this growth, with industrial added value increasing by 6.0% year-on-year, and manufacturing added value rising by 6.4%. Moreover, modern service industries maintained a strong development momentum: in the first quarter, the added value of information transmission, software and information technology services, leasing and business services, and financial services grew by 13.7%, 10.8%, and 5.2% year-on-year, respectively, collectively driving a 2.7 percentage point increase in the service industry’s added value. Marginally, the composite PMI output index, the manufacturing PMI, and the non-manufacturing business activity index all rose in March compared to the previous month, and all remained above the threshold line, indicating accelerated economic expansion.
A low base and external demand have bolstered improvements in exports. In the first quarter, exports and imports, denominated in RMB, grew by 4.9% and 5.0% respectively year-on-year, marking a rebound from the previous year’s fourth quarter. Looking regionally, while growth in exports to developed economies like the United States and the European Union slowed, there was a resurgence in growth in exports to Japan, South Korea, and the Chinese Taiwan region, with a concurrent recovery in growth in exports to ASEAN countries. In terms of products, driven by the rebound in global demand and the concurrent upturn in the global semiconductor cycle, exports of computer electronics industry chain products, represented by integrated circuits and automatic data processing equipment, saw a seasonally adjusted increase. Notably, March saw increased export growth rates for mobile phones, integrated circuits, and automatic data processing equipment, sequentially boosting the overall export growth rate by 0.5, 0.3, and 0.2 percentage points respectively compared to the previous month.
The growth rate of industries above designated scale accelerated overall. In the first quarter, industries above designated scale grew by 6.1% year-on-year, marking a 0.1 percentage point increase in growth compared to the fourth quarter of the previous year, continuing the trend of recovery. Looking at the three major categories, the growth rate of manufacturing increased by 0.4 percentage points to 6.7% compared to the fourth quarter of the previous year, while the growth rate of electricity, heat, gas, and water production and supply increased by 0.5 percentage points to 6.9%, both being the main drivers behind industrial recovery. Influenced by factors such as the timing of the Spring Festival and slow resumption of infrastructure and construction activities, the capacity utilization rates of industry and manufacturing fell to 73.6% and 73.8%, respectively, in the first quarter.
Policies, among other factors, have contributed to the rebound in investment growth. In the first quarter, the year-on-year growth rate of investment accelerated by 0.3 percentage points to 4.5%, compared to January and February, and increased by 1.5 percentage points compared to the previous year. Investment growth excluding real estate, however, reached 9.3%, highlighting the continued significant impact of real estate on investment growth. With the impact of policy support and other factors, investment growth in the high-tech manufacturing sector accelerated by 0.8 percentage points to 10.8% year-on-year in the first quarter, compared to January and February, and in turn drove investment growth in manufacturing to 9.9%.
Overall, consumer spending growth remained relatively stable in the first quarter. Total retail sales of consumer goods grew by 4.7% year-on-year, indicating slight slowing trends. As consumption policy measures were implemented, consumer potential accelerated, and commodity consumption steadily rebounded. Sales of essential goods were robust, with retail sales of grain and oil products and beverages increasing by 9.6% and 6.5% respectively. From a marginal perspective, the year-on-year growth rate of total retail sales of consumer goods slowed significantly to 3.1% in March, possibly due to a higher base last year. Meanwhile, rapid growth in consumption of travel and entertainment-related services continued to drive consumer spending.
Date: November 20, 2023
In October, China's economy may not appear to gain a strong recovery. However, a rational look at the situation shows there is some potential amid the current difficulties. Weakness in overseas manufacturing led to a decline in exports, impacting relevant industrial chains. Infrastructure and real estate investments remained weak, while manufacturing investment stayed stable owing to policy support and shifting demands. Supported by holiday promotions and a resurgence in service consumption, overall consumption remained resilient, although certain consumer goods experienced a slowdown in growth. Continuous decline in indicators including the Consumer Price Index (CPI) revealed the need for further stimulus including policy support to bolster internal momentum for economic growth.
October witnessed a slight decline in the Purchasing Managers’ Index (PMI), indicating a slowdown in the pace of overall economic expansion. The Composite PMI Output Index, Manufacturing PMI, and Non-Manufacturing Business Activity Index stood at 50.7%, 49.5%, and 50.6% respectively, dropping by 1.3, 0.7, and 1.1 percentage points compared to the previous month. All five sub-indices within the Manufacturing PMI registered decreases, signaling a deceleration in manufacturing production expansion, intensified demand contraction, reduced main raw material inventories, reduced labor use, and quicker delivery times from raw material suppliers. Furthermore, the Index of Service Production and Industrial Added Value demonstrated a slight acceleration compared to the previous month, primarily due to the base effect. While there was an increase in the year-on-year growth rate for October, the overall trend reveals a decline in the two-year compound annual growth rate for 2021-2023.
In October, exports were mainly influenced by seasonal factors and the global downturn in manufacturing industry prosperity. Regarding seasonality, there was an 8.1% month-on-month decrease in October’s exports, signaling ongoing instability in global demand. The global Manufacturing PMI dropped to 48.8%, reaching its lowest since July 2023. The growth in China’s exports to several regions also declined. In terms of products, the end of Christmas shipments led to a decline in the export growth rate of labor-intensive products. Simultaneously, the European Union’s anti-subsidy investigation into China’s new energy vehicles hindered the export growth of the automotive industry chain. Moreover, the export growth in the electronic industry chain displayed a divergence, with an uptick in mobile phone exports but a more significant decline in the exports of automated data processing equipment and integrated circuits.
For industrial enterprises above designated size, the year-on-year growth rate in October reached 4.6%, slightly up from the previous month, while the industrial growth rate from January to October slightly increased to 4.1%. Mining and manufacturing emerged as the primary drivers of growth, especially noticeable in the continuous three-month upturn in equipment manufacturing. However, after excluding the base effect, regarding the two-year compound annual growth rate, October saw a year-on-year growth rate of 4.8% for industrial enterprises above designated size, slightly down from the previous month. This decline was mainly due to specific industries stocking up ahead of time, resulting in the release of a portion of production demand last month. Inadequate foreign demand affected export-related manufacturing, while diminishing domestic demand in infrastructure and real estate investment continued to weaken related industrial chains.
October registered an overall year-on-year investment growth rate of 2.9%, showing a slight decrease compared to the previous month. Manufacturing investment remained stable, but there was a continued decline in both infrastructure and real estate investments. The slowdown in infrastructure investment growth can be attributed to factors such as a high base effect and a slowdown in the issuance of special bonds. Except for electricity, heating, and hydraulic power, the year-on-year growth rate in other sub-items has declined. Manufacturing investment experienced a slight dip, along with reduced investment in high-tech industries, automobile manufacturing, electrical machinery and equipment manufacturing, computer communications, and other electronic equipment manufacturing. Real estate investments, sales volume, sales area, and funding sources continued to weaken. Private real estate investment showed a marginal rebound overall, particularly noticeable when excluding real estate development investment, signaling a gradual recovery in the confidence for investment among private enterprises.
From January to October, there was a 6.9% year-on-year increase in retail sales of consumer goods. Notably, automobile consumption helped to boost overall consumer spending in October. From January to October, service retail sales saw a slight improvement with a 19.0% year-on-year growth. The effect of new energy vehicle policies started to be felt and resulted in an 11.4% growth in retail sales of passenger cars. The adjustment of policies in the real estate market also led sectors like home appliances, furniture, and building decoration to turn positive after 12 months. Regarding service consumption, the year-on-year growth rate of catering services rose to 17.1%. However, it is worth noting that the rebound in the growth rate of total retail sales of consumer goods was significantly influenced by a low base effect.


Date: Feb 27, 2023
Because of Chinese New Year, the statistics bureau didn’t announce price, financial and PMI data until February. China switched from zero-COVID lockdown to almost no restrictions in December 2022, and by January 2023, normal life had nearly returned. The economy is generally improving, but caution about its sustainability is required.
Manufacturing PMI, the non-manufacturing business index and the composite PMI production index were 50.1%, 54.4%, and 52.9% in January 2023, up 3.1, 12.8, and 10.3 pps from December. All rose to the improvement zone, showing that the economy is recovering. Our in-depth analysis instead shows that the improvement is still mainly from infrastructure investment. Our survey data shows most industries and firms are only the same or in slightly better shape than in January 2022 - not a big jump from the zero-COVID policy period.
In January 2023, PPI fell -0.4% m/m, growing -0.8%, down 0.1 pps, largely because of falling oil and coal prices. CPI mildly increased. CPI rose 2.1% y/y in January, up 0.3 pps from December 2022. The rise is from demand release after pandemic control relaxation and the New Year’s holiday effect.
Monetary policy expanded. At the end of January, M1 rose 6.7% y/y, up 3 and 8.6 pps from December 2022 and January 2022, respectively. M2 rose 12.6% y/y, up 0.8 and 2.8 pps from the end of December and January 2022, reaching its peak since April 2016. The increase is due to both household deposits and enterprise loans, showing monetary policy expansion.
Chinese banks extended record lending in January, after authorities prodded them to lend more to businesses, though consumer borrowing remained subdued. In particular, financial institutions offered 4.9 trillion yuan of new loans, above the 4.2 trillion yuan estimated by economists on average, and from the earlier record of 3.98 trillion yuan a year ago. Part of the loan increase was moved from bond financing. Although this news is positive, we don’t expect economic recovery to be as strong as other analysts forecast, since consumer confidence is low.


Date: Jan 29, 2023
GDP grew 3% in 2022. Specifically, China’s economy rose by 2.9% y/y in Q4 2022, down from the 3.9% growth reported in Q3. Many negative factors affected the economy in 2022, including global macroeconomic tightening, the Ukraine crisis, real estate restructuring, the pandemic management policies and so forth. As some of the above factors abated, particularly abolishment of the zero-COVID policy, we expect that, after a turbulent 2022, the economy will be back on track in 2023.
Industrial output grew 3.6% in 2022, down 6 pps from 2021. Investment rose 5.1%, up 0.2 pps, driven mainly by state investment. Consumption fell significantly, by -0.2% y/y, from 2021, down 12.7 pps, from repeated lockdowns.
Exports rose 10.5%, down 10.5 pps from 2021. Exports’ monthly growth rates displayed a downward trend. Net exports’ contribution to GDP only accounted for 0.5 pps. Particularly in Q4, the share of exports in accounting for GDP growth is only -1.2 pps, negatively impacted by weak global demand and the dramatic change in domestic COVID policy.
Prices are instead facing deflation risk. In 2022, PPI rose 4.1% and CPI rose 2%. However, both displayed slowing trends. In December, PPI and CPI only grew -1.1% and 1.8% y/y. Monetary policy is still stable. M1 rose 3.7% y/y, down 0.9 pps. M2 increased 11.8% y/y, down 0.6 pps, partially reflecting weak money demand.
A series of government policies is being released to stabilize the real estate market, while discouraging speculation. On January 5th, the People’s Bank of China announced that it would allow banks in cities that experienced housing price declines to cut mortgage rates for first-time house buyers. This directive followed last month’s meeting by top national leaders, which typically gives guidance in line with the coming year’s main economic theme, and this year stated that housing consumption would be a significant way to expand national consumption. We believe the housing market will mildly strengthen this year, but not thrive. Positive factors are the abandoning of any pandemic restriction, the banking sector’s efforts to keep most real estate developers solvent and the already relatively low base number.
Date: Nov 24, 2022
Growth is weakly recovering, with pressure ahead largely from the Covid prevention and its related lockdowns. Although there was some rumor regarding abandoning the zero-Covid policy, there were also signs that China will commit to this policy in the short term, citing reasons from state media that China’s per capita medical resource is low. We forecast that although there might be some relaxing adjustment, for example that foreign entry has reduced to five-day quarantine from seven days, the zero-Covid policy will not be abandoned soon.
In January-October, industrial output rose 4% y/y, continuing its weak recovery since May. Investment rose 5.8% y/y, down 0.1 pps from first three quarters. China’s PMI, manufactural PMI, and non-manufactural business activity index were 49%, 49.2%, and 48.7%, down 1.9, 0.9, and 1.9 pps from September.
Retail sales of social consumption goods fell -0.5% y/y, down 3 pps from September. Exports in October rose 7% y/y, down 3.7 pps from September. The global weakening demand is the main reason behind slower exports and very likely to persist in the medium term.
Economic slowdown is driving down prices. PPI fell -1.3% y/y, down 2.2 pps from September. CPI rose 2.1% y/y, down 0.7 pps from September. The global interest rate increase to combat inflation has limited Chinese central bank’s ability to cut interest rate to support the economy. Loan demand is weak. M1 rose 5.8% y/y, down 0.6 pps. M2 rose 11.8% y/y, down 0.3 pps.
On November 11th, Beijing unveiled a 16-point plan that significantly eases a crackdown on lending to the real estate sector, leading to property developers’ share instantly increase by 11%. Key measures include allowing banks to extend maturing loans to developers, supporting property sales by reducing previous sale restrictions, boosting other funding channels, and ensuring the delivery of pre-sold homes to buyers. We believe these policies will calm the market and make real estate cooling milder, but unlikely to reverse the downward trend immediately. However, real estate collapse or systemic risk can be avoided.


Growth strengthened, but only slightly. In August, industrial output rose 4.2% y/y, up 0.4 pps, lifting overall January-August growth to 3.6%, up 0.1 pps. Investment rose 5.8% y/y in January-August, up 0.1 pps. The August growth rate was 6.4% y/y, up 2.8 pps. Real estate investment growth rate fell further, to -13.8% y/y, down 1.7 pps from August 2021.
In August 2022, consumption rose 5.5% y/y, up 2.7 pps. This is partly due to the low base number of last year, when consumption rose 2.5%, and was down 6 pps from August 2021.
Exports rose 11.8% y/y, down 12.1 pps from July 2022. This seems partially because all major countries except China are exiting from monetary expansion, leading to weakened demand. This month was the first time where exports to the United States had negative growth of -3.8% y/y, dragging down total export growth by 3 pps.
PPI rose 2.3% y/y in August, down 1.9 pps. A major contributing factor is that the production material price growth rate was down 2.6 pps. CPI rose 2.5% y/y, down 0.2 pps from July. Monetary policy remained neutral. At the end of August, M0 rose 14.3% y/y, up 0.4 pps from July. M1 increased 6.1% y/y, down 0.6 pps from July. M2 rose 12.2% y/y, up 0.2 pps.
The offshore exchange rate of the Chinese yuan versus the U.S. dollar recently breached the 7:1 mark for the first time in over two years. Similar to other global currencies that have depreciated in 2022, the yuan’s decline is being driven by the strengthening of the dollar. However, the yuan “basket index” has been relatively stable, and the yuan is unlikely to see significant depreciation, given our forecast of a good balance of payments and overall macroeconomic recovery from further stimulative fiscal policy in the coming months. Other major currency determinants are also sound for the yuan, including a high position for the interest rate and foreign reserves.


Industrial output grew 3.5% y/y in January-July, up 0.1 pps from H1. In January-July, investment rose 5.7% y/y, down 0.4 pps from H1. In particular, the investment growth rate in July was down 2.4 pps from June. High infrastructure investment has been flattened by reduced real estate investment.
Retail sales of social consumption goods fell -0.2% y/y in January-July, up 0.5 pps from January-June. Exports were still strong. In July, exports rose 23.9% y/y, up 1.9 pps from June. Due to the stop of global monetary policy easing, the continuing Ukraine crisis, and the ongoing pandemic, other countries have not recovered well, giving more opportunities to Chinese companies.
PPI and CPI continued to converge. In July, the global crude oil price dropped significantly, leading the overall price level in China to fall. PPI rose 4.2% y/y, down 1.9 pps. CPI rose 2.7% y/y, up 0.2 pps from June, mainly driven by food prices. Monetary policy is easing, but at a small scale due to inflation concern. In the end of July, M0 rose 13.9% y/y, up 0.1 pps from June. M1 rose 6.7% y/y, up 0.9 pps. M2 rose 12% y/y, up 0.6 pps.
The real estate market has been cooling for over a year, and has become particularly cold. In August, China’s property sales plunged almost a third, more than during the 2008 financial crisis. Real estate investment growth fell further to -12.3%, after falling -9.4% in June and -10.1% in April. The real estate sector takes one third of GDP, and so receives much attention. We view the picture as completely different from the 2008 U.S. housing crisis. It is the Chinese government who started this real estate deleveraging, in view of potential future financial problems, and so it is largely manageable. There are also complementary policies, such as bailing out home buyers. Risk is containable, but the process is painful, and will take some time.
GDP only grew 2.5% y/y in H1. As the pandemic shock has been gradually under control and the start of various economic stabilization policies, the recovery growth in June has lifted the Q2 growth to achieve positive growth at 0.4% y/y, contributing to the path “back to normal”.
In H1, industrial output rose 3.4% y/y, down 3.1 pps from Q1. In H1, investment growth rate was 6.1% y/y, down 3.2 pps from Q1, but still 1.2 pps faster than 2021. The continuing real estate cooling does not see any time ending.
Pandemic lockdowns suppressed consumption. Retail sales of social consumption goods fell -0.7% y/y, down 4 pps from Q1. Survey data shows Chinese consumers are pessimistic about future income growth putting more constraint on future consumption recovery. In H1, exports rose 13.2% y/y. In June alone, exports rose 22% y/y, accelerating since April, and is an important force lifting economic recovery.
In H1, PPI rose 7.7% y/y. CPI increased 1.7% y/y. Low inflation benefits from the recovery of supply chains, domestically and internationally. However, future inflation pressure is still high. The main financial indicators were loosened somewhat countercyclically. At the end of June, M2 rose 11.4% y/y, up 0.3 pps from May, and up 1.7 pps from Q1, slowly picking up. M1 rose 5.8% y/y, up 1.2 pps from May, and up 1.1 pps from Q1.
China’s unemployment situation is worsening. According to the National Bureau of Statistics, the government official source, China’s youth unemployment rate for ages from 18 to 24 hit an all-time high of 19.3% in June. It was a sharp rise from 18.4% in May and marked a year-on-year increase of 25%. We believe the unemployment might not pose a society crisis. Parents in China usually provide living net. The unemployment leans more to friction cause. For example, many campus recruitments were suspended because of the pandemic.
Government will continue its effort to bring the economic activities to a higher level. However, it seems not necessary for China to stimulate the economy by additional measures. On July 20th, China’s Prime Minister Li Keqiang stated that China will not adopt large stimulus policies.


Because of the long Chinese New Year holiday, the statistics bureau only announced price, financial and PMI data in February. Producer prices grew more slowly. PPI rose 9.1% y/y, down another 1.2 pps from December. The ex-factory price index of industrial goods rose 8.85% y/y, while CPI growth also slowed. CPI rose 0.9% y/y in January, down 0.6 pps from December. In particular, food prices fell -3.8% y/y, down 2.6 pps from December, dragging CPI down 0.72 pps. That is the leading factor lowering CPI. The falling price levels offer ample room for further money expansion.
At the end of January, M2 rose 9.8% y/y, up 0.8 pps from the end of December, and up 0.4 pps from January 2020. M2 is not strongly affected by the Spring Festival effect. The significant trending upward reflects expansionary monetary policy. M1 fell -1.9% y/y. The adjusted growth rate after taking out the effect of the New Year’s holiday was around 2%. M0 rose 18.5% y/y, a major increase.
The societal financing scale increased by 6.17 trillion yuan in January, much higher than in January 2020, and market expectations. The societal financing scale increased 10.5% y/y, up 0.2 pps from December. The structural composition of societal financing is also improving. PMI fell, but was still in the improvement zone in January. In particular, PMI was 51%, down 1.2 pps from December. This indicates that the overall economic situation is good, and in an expansion zone, but the trend is slowing.
The Ministry of Finance disclosed on February 14th that to that date, some 1.788 trillion yuan ($278 billion) of this year's newly-increased debt limit of local government bonds had been allocated in advance. Of the amount already allocated, 1.46 trillion yuan is for the local government special bond quota. We expect this expansionary fiscal policy to bolster local government financing needs and investment, to ensure growth stability. The early distribution will also have a larger spillover effect for the rest of the year. The government debt ratio in China is still much lower than it in the United States, so financial risk should be containable.


The COVID-19 lockdowns in Shanghai and some other cities since late March have halted the strong economic recovery. In Q1, GDP was up 4.8% y/y, up 0.8 pps from Q4 2021, but 0.2 pps lower than in Q1 2020. Industrial output rose 6.5% in Q1, up
2.6 ppts from Q4, but down 1 pps from January-February. Investment rose 9.3% y/y in Q1, up 4.4 pps from 2021, but 2.9 pps lower than in January-February.
In March, overall PMI, manufacturing PMI, and non-manufacturing business activity PMI were 48.8%, 49.5% and 48.4% respectively, all falling steeply from the previous month, demonstrating that the economic environment has been shrinking in all dimensions.
In Q1, retail sales of consumption goods were up 3.3% y/y, down 9.2, 0.2 and 3.4 pps from 2021, this January and February respectively. In March, consumption fell -3.5% y/y; restaurant income fell -16.4% y/y, its first negative turn after more than one year.
Exports rose 13.4% y/y in Q1, down 4.6 and 0.2 pps from Q4 2021, January-February. Weak export is more because of foreign weakening demand factors, including the Russia-Ukraine war and the Fed raising rates, than because of domestic lockdowns.
In Q1, PPI rose 8.7% y/y, down 3.5 pps from Q4. Production material slowdown is the main reason for lagging PPI growth, and its growth rate was 4.8 pps, down from Q4. In Q1, CPI rose 1.1% y/y, higher than last year. In March, CPI rose 1.5% y/y, a clear rise from January and February. We expect higher CPI to persist.
Shanghai, China’s largest economic and financial center, has been under lockdown since March 27th. On April 26th, Beijing was put on Omicron alert. China's yuan fell to a one-year low, at 6.5 against a strengthening dollar on April 25th, extending losses after posting its worst week since 2015. The economy will be volatile in the near term. However, a depreciating yuan benefits export. The Chinese government is also accelerating fiscal expansion to keep the economy afloat. For example, infrastructure investment rose 8.5% y/y in Q1, up 8.1 and 0.4 pps from last year and January- February respectively.
Executive summary
Because of the long Chinese New Year holiday, the statistics bureau only announced price, financial and PMI data in February. Producer prices grew more slowly. PPI rose 9.1% y/y, down another 1.2 pps from December. The ex-factory price index of industrial goods rose 8.85% y/y, while CPI growth also slowed. CPI rose 0.9% y/y in January, down 0.6 pps from December. In particular, food prices fell -3.8% y/y, down 2.6 pps from December, dragging CPI down 0.72 pps. That is the leading factor lowering CPI. The falling price levels offer ample room for further money expansion.
At the end of January, M2 rose 9.8% y/y, up 0.8 pps from the end of December, and up 0.4 pps from January 2020. M2 is not strongly affected by the Spring Festival effect. The significant trending upward reflects expansionary monetary policy. M1 fell -1.9% y/y. The adjusted growth rate after taking out the effect of the New Year’s holiday was around 2%. M0 rose 18.5% y/y, a major increase.
The societal financing scale increased by 6.17 trillion yuan in January, much higher than in January 2020, and market expectations. The societal financing scale increased 10.5% y/y, up 0.2 pps from December. The structural composition of societal financing is also improving. PMI fell, but was still in the improvement zone in January. In particular, PMI was 51%, down 1.2 pps from December. This indicates that the overall economic situation is good, and in an expansion zone, but the trend is slowing.
The Ministry of Finance disclosed on February 14th that to that date, some 1.788 trillion yuan ($278 billion) of this year's newly-increased debt limit of local government bonds had been allocated in advance. Of the amount already allocated, 1.46 trillion yuan is for the local government special bond quota. We expect this expansionary fiscal policy to bolster local government financing needs and investment, to ensure growth stability. The early distribution will also have a larger spillover effect for the rest of the year. The government debt ratio in China is still much lower than it in the United States, so financial risk should be containable.
Producer prices rose more slowly
Because of the long Chinese New Year holiday, in January (as usual), the statistics bureau only announced price, PMI index and financial data. So the analysis does not cover much. In January, PMI fell, but was still in an improvement zone. The detailed classification indicates that demand is still weak, but also suggests that market expectations are improving.
Faster money growth and societal financing scale indicate that the real economy’s financing demand has recovered. We expect fiscal policy to be intensive as well, with infrastructure projects accelerating their pace of construction. The lowering overall price level also lends a possibility for further monetary loosening. With the Spring Festival effect, part of the non-food and service categories’ price supports further CPI appreciation. But pork prices are falling significantly. The two opposite changes keep the CPI stable.
From the published data, in January, PPI rose 9.1% y/y, further down 1.2 pps from December. In particular, production material price rose 11.8% y/y, down 1.6 pps from December. Living material prices rose 0.8% y/y, down 0.2 pps.
The production material price fluctuation is the main factor driving the ex-factory price index of industrial goods. The latter rose around 8.85% y/y. Its slowdown is the main factor pushing down PPI growth.
For specific industries, main industries that saw their prices growing more slowly are coal, oil and gas, black metal mining and refinery. Those industries rose 51.3%, 38.2%, 30.1%, and 14.7% y/y, down 15.5, 7.4, 6.3, and 6.7 pps respectively.
GRAPH 1
Change in CPI and Ex-Factory Price Index of Industrial Products (y/y, %)
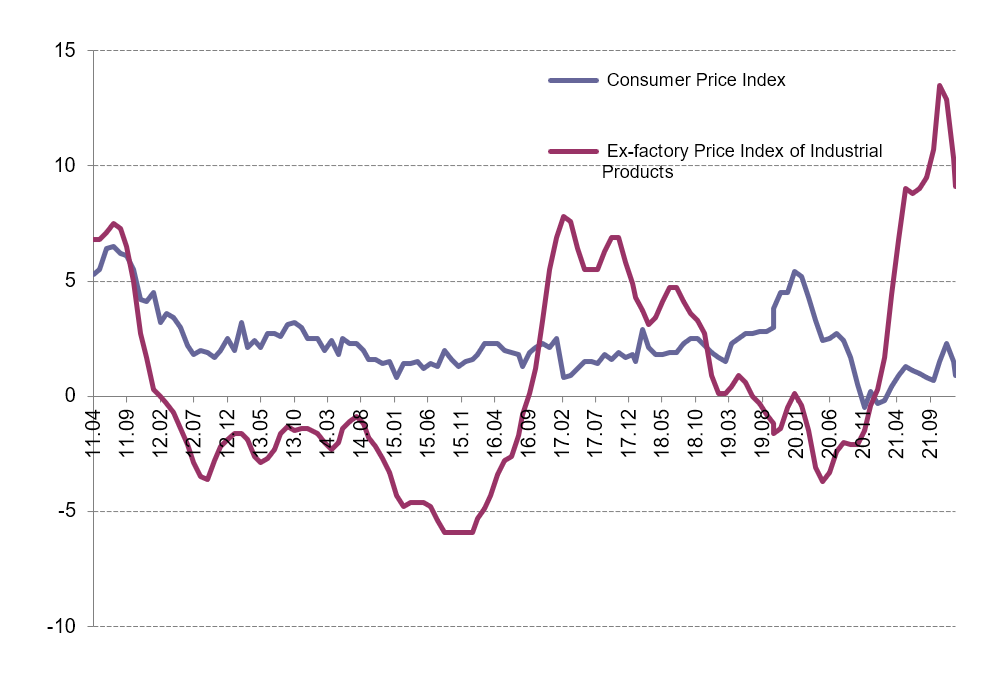 Source: Chinese State Statistical Bureau
Purchasing prices of industrial producers rose 12.1% y/y, and fell -0.4% m/m. The latter’s growth rate is down more from December than the y/y growth rate, leading the ex-factory price index to fall.
The main price compositions of gas, chemical, and black metal related materials rose 30%, 17.9%, and 9.8% y/y, and fell -0.9%, -1.1%, and -0.7% m/m respectively, driving PPI had its m/m growth rate negative.
The slowdown of the ex-factory price index and PPI show that central government policies to beat down prices have been effective. The slowdown of PPI m/m growth rate led to coal mining, and black metal refinery to decrease -3.5% and -1.9% m/m, contributing to the overall industrial good price to fall. But affected by global oil and gas price increase, domestic oil and gas mining price rose 2.6%, up 9.5 pps from December. The globally dependent nature of oil and gas leads to their large fluctuations from the global factor.
CPI growth also slows
CPI rose 0.9% y/y in January, down 0.6 pps from December. In particular, food prices fell -3.8% y/y, down 2.6 pps from December, dragging down CPI around 0.72 pps. That is the leading factor lowering CPI.
Pork prices fell -41.6% y/y, because of the high base number of last year, down 4.9 pps from December, which instead is the main factor leading the food price decline. Vegetable price fell -4.1% y/y, down 14.7 pps from December. For m/m growth rates, food price rose 1.4% m/m, up 2 pps from December. The Spring Festival effect has pushed up fruit and seafood price to increase 7.2% and 4.1% m/m respectively, which are the main factor keeping up the food price.
Non-food prices rose 2% y/y, down only 0.1 pps from December. The high demand for oil and gas from the transportation demand increase due to the New Year’s holiday effect is the main contributing factor to non-food price increase. Specifically, gasoline and diesel oil prices rose 20.7% and 22.7% y/y respectively, which then contribute to industrial good price to rise 2.5% y/y.
The service price index rose 1.7% y/y, up 0.2 pps from December. This was mostly due to airfare and household related service prices rising 20.8% and 6.2% y/y.
For m/m growth rates, prices for oil, diesel oil, and gas rose 2.2%, 2.4%, and 1.5% m/m. Air tickets, transportation rental fees and long-distance coach prices rose 12.4%, 9.8%, and 5.2% m/m. House cleaning, babysitting and haircut prices rose between 2.6% and 9.1% m/m. After we take out the food and energy factors as compositions of CPI, the other prices rose 1.2% y/y overall, the same rate as in December, indicating the overall CPI growth is mild.
Signs of expansionary monetary policy
M2 was up 9.8% y/y at the end of January, up 0.8 pps from the end of December, and up 0.4 pps from January 2020. M2 is not strongly affected by the Spring Festival effect. The significant trending upward reflects expansionary monetary policy.
M1 fell -1.9% y/y. The adjusted growth rate after taking out the Spring Festival effect was around 2%. M0 rose 18.5% y/y, a large increase. What the changes of M0 and M1 reflect are the Spring Festival effect. It is customary for firms to distribute compensation and welfare in a lump-sum way to households. This leads to the transition from enterprise saving to individual savings. As seen from the data, household savings increased 5.41 trillion yuan, and non-financial enterprises savings reduced 1.4 trillion yuan. But M1 growth rate is lower than expectation probably because house purchase intention is still low in January. It is hard for household saving to transit to enterprise savings.
GRAPH 2
Change in M0, M1, and M2 (y/y, %)
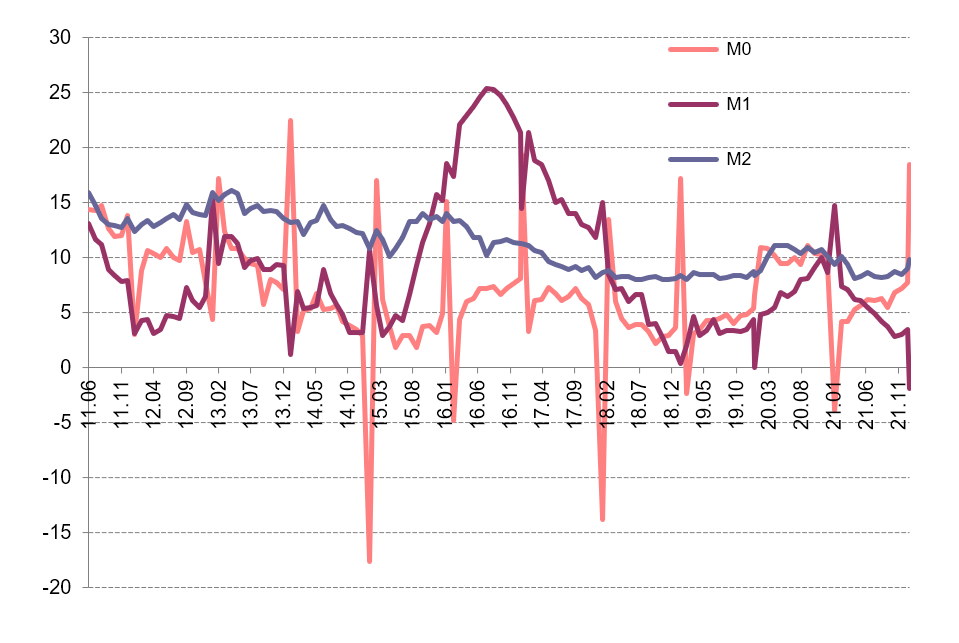
Source: Chinese State Statistical Bureau
The societal financing scale increased by 6.17 trillion yuan in January, much higher than in January 2020, and market expectations. The societal financing scale increased 10.5% y/y, up 0.2 pps from December.
The structural composition of societal financing is also improving. In particular, RMB loans under the customary societal financing standard increased 4.2 trillion yuan, 380.6 billion yuan more than last January. Government bond net financing rose 579.9 billion yuan, 188.2 billion more than last January. The aggregate of trusted loan, entrusted loan, and non-discounted bank note increased 447.9 billion yuan, 32.8 billion yuan more than last January.
Loans, corporate debt, and bank outside-balance-sheet business had major increases, except regulatory delay for government bond financing and private company to go public.
Our analysis above shows that the societal financing scale increased significantly; its composition structure also improved. Both of these show that, with all the efforts from back-to-normal monetary policy, less regulation for commercial banks, and infrastructure acceleration, monetary policy has more and more impacts on the real economy.
PMI fell, but remained in an improvement zone
Overall PMI was 51% in January, down 1.2 pps from December. This indicates that the general economic situation is good, and in an expansionary zone, but the trend is falling.
In particular, manufacturing PMI was 50.1%, down 0.2 pps from December. This is also consistent with the overall economy, which is still in an expansionary zone, but with slowing growth.
GRAPH 3
PMI Index (y/y, %)
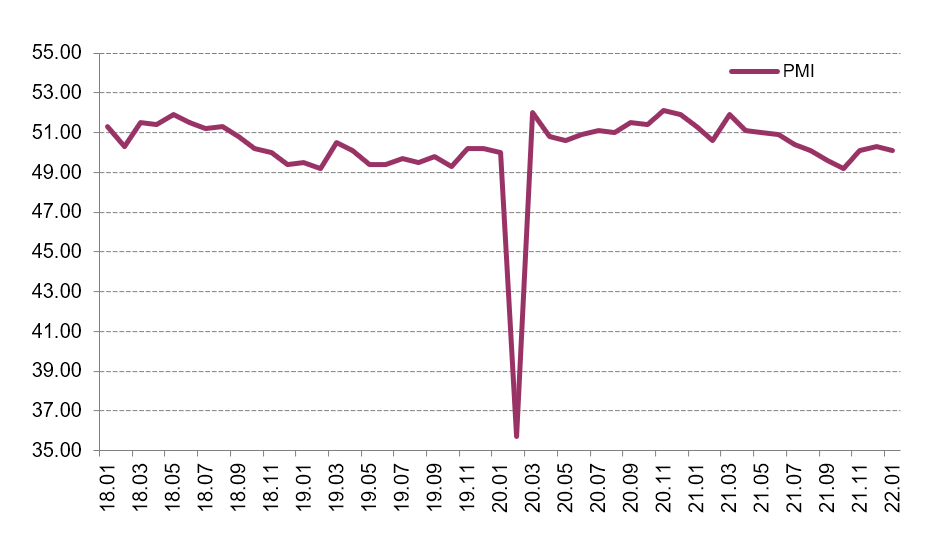
Source: CEIC data
Non-manufacturing PMI was 51.1%, down 1.6 pps from December. This is also consistent with the overall economic PMI.
For specific categories, new manufacturing orders decreased -0.4% m/m, showing weak demand. But manufacturing activity expectations, new construction orders and related activity rose 3.2, 3.3, and 0.6 m/m from December, and reached their PMI of 57.5%, 53.3%, and 57.9%, reflecting improving market expectations.
Local bond issue acceleration will keep economy stable
The Ministry of Finance disclosed on February 14th that to date, some 1.788 trillion yuan ($278 billion) of this year's newly increased debt limit of local government bonds had been allocated in advance. Of the amount already allocated, 1.46 trillion yuan is for local government’s special bond quota. We expect this expansionary fiscal policy to help local government’s financing needs and investment, to ensure growth stability. The early distribution will also have a larger spillover effect for the rest of the year. Government debt in China is still much lower than it in the United States, so financial risk should be containable.
Around the same time, on February 22nd, net onshore bond issuance by state-owned enterprises (SOEs) owned by the Henan provincial government turned positive in Q4 2021. Funding conditions stabilized after the default of Yongcheng Coal in November 2020 dampened investor appetite for securities issued by Henan SOEs in H1 2021, then reflected a return of investor confidence.
GRAPH 4
Local Government Special Bond (Billion yuan)
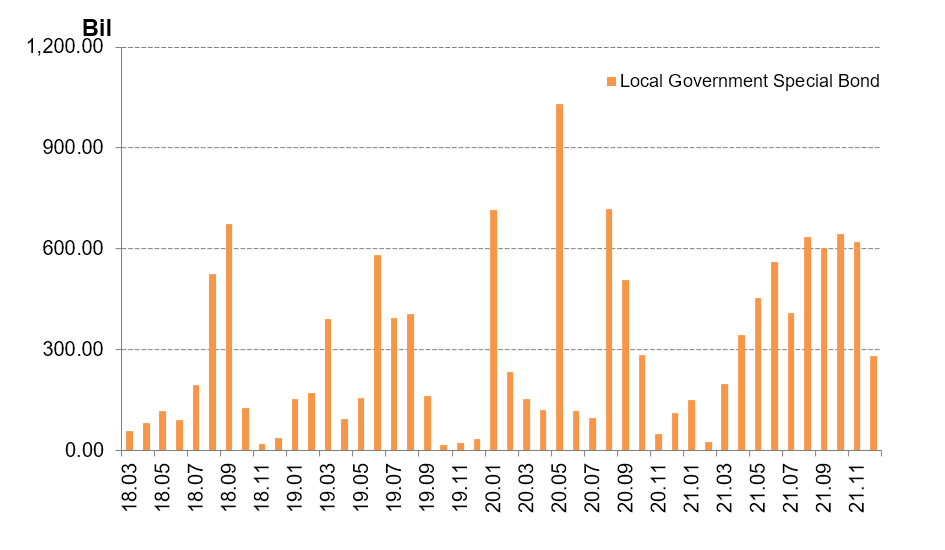
Source: National Bureau of Statistics
Although where local government special bonds will be put into use is not specifically clear, we can draw a big picture from where the bond was allocated last year, and we expect it to still be largely consistent with those fractions, as there is no specific different shock.
In 2021, half of the bond was in the area of transportation infrastructure. From the rough mention for the plan in 2022, the largest category is still transportation infrastructure. Other categories are energy, agriculture --particularly forestry and water -- environmental protection, social security and production chain infrastructure.
One concern of using these debt-driven infrastructure growth is the whole debt level and potential financial risks. The Chinese government seems to pay particular attention to this issue. All the reports have repeatedly mentioned that the financial risks need to be carefully watched. The graph below also shows that China’s debt ratios are still below those of the United States, leaving further room to add more debt. Compared to other instruments, issuing bonds can contain an inflation and asset bubble.
GRAPH 5
Debt to GDP (%)
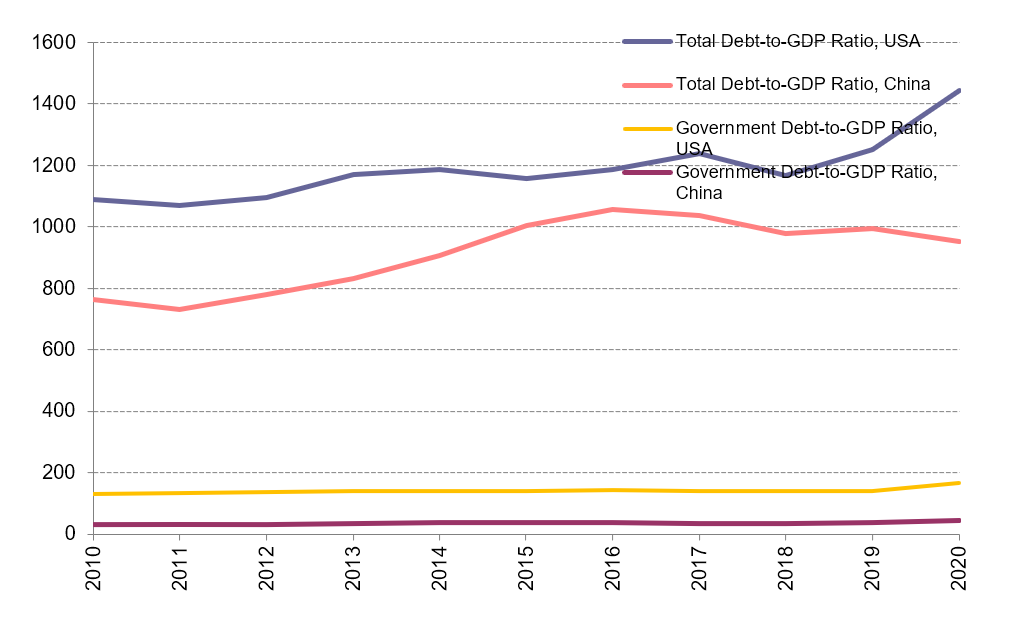
Source: National Bureau of Statistics
In our view this special bond has two different advantages over previous local government debt. If the central government simply approves any local government’s request to issue more debt, then there will be strong debt- and capital-misallocation. This is because the poorer regions will have a greater need to issue debt. However, one reason they are poor is due to their low productivity. If money is allocated to such regions, then the expected return should be lower. There will be a vicious cycle under this scenario. The financial market itself might have limited power to discipline because of its state-owned nature. Instead, currently, the central government carefully monitors the approval of these bonds, so that their efficient level should be higher.
Second, the previous local government is mainly financed by local banks. Given crony relations in small local areas, the financing is less efficient compared to the current arrangement. The national financial market that follows greater market discipline will determine bond quantity and pricing.


Growth continues to be weak. In November, industrial output grew 3.8% y/y, down 1.1 pps from Q3, much lower than the growth rates of recent years. Investment is also low, and was up 7.9% y/y, and down 1.2 pps from January-June. Its adjusted growth rate is instead negative. The real estate market is still cold: sales were down -14.2% y/y in November.
Consumption rose 3.9% y/y in November, down 1 pps from October, and its adjusted growth rate was 0.5% y/y, hitting its lowest level this year. But trade is still strong. Imports were up 26% y/y, and up 9.8 pps from Q3. Exports were up16.6% y/y.
Producer price growth finally reversed to a downward trend. The price level of the index of ex-factory industrial goods was the same as in October, and up 12.9% y/y, down 0.6 pps from October. PPI increased 1% m/m, 17.4% y/y from October, up 0.3 pps from October. We expect PPI growth to be slower next month. In November, CPI rose 2.3% y/y, up 0.8 pps from October. Its adjusted growth rate is the same as in October.
Principal financial indicators operated at low levels in November. M2 rose 8.5% y/y, comparable with 2018 and 2019. M1 rose 3%, up only 0.2 pps from the lowest growth rate this year. There is still uncertainty over whether money growth’s downward trend will be reversed. Loan growth has been at its lowest since 1990, for three consecutive months.
The yuan has risen 2.6% against the dollar this year, even with the dollar strengthening 8% since May. This is in contrast to an unexpectedly weaker Chinese economy, and to real estate risks highlighted in the news headlines. Appreciation is likely due to strong export and investor confidence. We expect that the yuan may appreciate mildly in 2022, and that it won’t fall below 6 against the dollar. This is based on an expected stronger dollar, and expectations of further growth slowdown in China in 2022.
Growth has weakened, especially in services. In August, industrial output grew 5.3% y/y, and was up 11.2% from August 2019, with an annualized growth rate of 5.4%, down 0.2 ppts from July, and down 1.2 ppts from Q2. The service production index has slowed since Q2, and grew only 4.8% y/y in August, after being further hit by the COVID outbreaks, down 2.9 ppts from Q4 2020, and down 2.1 ppts from 2019.
Investment was up 8.9% y/y January-August, and increased 8% from August 2019, with an annualized growth rate of 4%, down 0.5 ppt from H1. Real estate is cooling dramatically, to the 2008 financial crisis level. COVID outbreaks in August negatively impacted consumption. Retail sales of social consumption goods rose 2.5% y/y, down 6 ppts from July. Their growth rate after price adjustment was 0.9% y/y. As we forecast, trade became weaker. Exports rose 15.7% y/y, down 4.4 ppts from Q2. Imports rose 23.1% y/y, down 8.5 ppts from Q2.
Producer prices increased further in August. The ex-factory price index of industrial goods rose 9.5% y/y; PPI increased 13.6% y/y, both 0.5 ppts higher from July. However, we forecast that producer price appreciation will stabilize in November, and that prices will begin to fall. CPI rose 0.8% y/y, falling for three consecutive months. We expect the lowering of CPI to be temporary, and to reach around 2%, after food prices stop declining.
In August, monetary policy continued its tightening trend. M2 rose 8.2% y/y, basically stable since April. M1 rose 4.2% y/y, continuing to fall, reaching its the lowest of 2021, down 0.7 ppts from July.
China is announcing intensive policies in specific key areas, to address structural reform. In the financial industry area, President Xi Jinping announced on September 2nd that a third stock exchange in Beijing would be established, in addition to the existing two exchanges in Shanghai and Shenzhen, to serve small and medium-sized businesses. In regional policies, Shenzhen’s Qianhai and Zhuhai’s Hengqin areas are being pushed to deepen their ties with bordering Hong Kong and Macau. The Qianhai economic zone is to expand eightfold. There are also other new industry rules for the real estate and education sectors. All of these plans underscore the central government’s effort to develop a healthier economy, by being more open and more market-based. But policy uncertainty looms over investment in the short term. The possible default of real estate companies such as Evergrande also raises some fear of turmoil in China’s financial market. But we do not see this as a systematic threat.
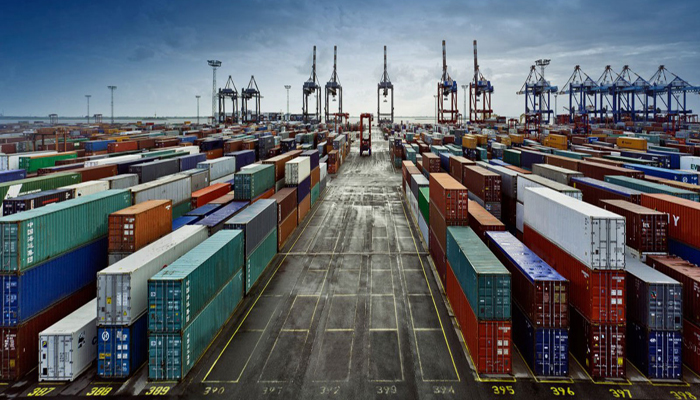
The Chinese economy has been stably rising in Q2. GDP was up 7.9% y/y, and up 11.4% from Q2 2019, with an annualized growth rate of 5.5%, up 0.5 pps from Q1. Industrial output was up 8.9% y/y, and up 13.7% from Q2 2019, with an annualized growth rate of 6.6% y/y, slightly lower than in Q1 but higher than the pre-pandemic 2019 level; specifically, growth in June was 6.5%.
Investment was up 12.6% y/y, and increased 9.1% from Q2 2019, with an annualized growth rate of 4.4% y/y, up 1.8 pps from Q1, and down 1 pps from 2019. In Q2, retail sales of social consumption goods were up 9.5% from Q2 2019, with an annualized growth rate of 4.6% y/y, up 0.5 pps from Q1. In June, trade continued its strong growth. Exports rose 20.2% y/y, comparable to the average growth rate in March-May, while imports rose 24.4% y/y, up 5 pps from Q1.
Producer price growth slowed in June, but we expect it to pick up soon. The ex-factory price index of industrial goods increased 8.8% y/y, down 0.2 pps from May. CPI rose 1.1% y/y, down 0.2 pps from May, contributed by falling meat prices.
The main financial indicators saw diverging trends in June. The societal financing scale switched from large drops in previous months to positive growth of 7.7% y/y. M1 continues its declining growth trend. At the end of June, M2 rose 8.6% y/y, lower than most of the previous months. M1 rose 5.5% y/y, down 0.6 pps from May.
The pandemic shows no sign of vanishing from the world. This situation makes central banks around the world unlikely to exit from lowered interest rates and other stimulus measures. The vaccine situation in developed countries is much better than in the rest of the world. China’s strong recovery over the past 12 months is mainly derived from exports. This driving growth factor may be weakened by the economic recovery in developed countries, as they resume their production and reduce their demand for China’s exports later this year. China is therefore facing downturn pressures, amid an environment of globally increasing inflation.
Growth was stable in May. Industrial output rose 8.8% y/y, and increased 13.6% from May 2019, with an annualized growth rate of 6.6%. Investment rose 15.4% y/y, and increased 8.5% from May 2019, with an annualized growth rate of 4.2% y/y -- still in a low growth zone.
Consumption has recovered further. In May, retail sales of social consumption goods rose 9.3% y/y from May 2019, with an annualized growth rate of 4.5%, up 0.2 pps from April. Trade has been strong since the beginning of this year, especially for imports, which are growing robustly. In May, imports rose 39.5% y/y. Exports rose 18.1% y/y, down 4.1 pps from April, but still 7.1 pps higher than in Q4 2020.
Producer prices have been appreciating since Q2 2020, and are rising particularly fast this year, most likely from overseas monetary liquidity loosening. In May, the ex-factory price index of industrial output rose 9% y/y. The PPI growth rate reached 12.5% y/y. The growth rates of both were higher than their peak points in 2017 and 2010. In May, CPI rose 1.3% y/y. Although this growth rate is not high, the trend is forming, and picking up.
Monetary and financial indicators kept weakening in May. M2 rose 8.3% y/y. M1 rose 6.1% y/y, down 0.1 pps from April. Saving deposits from non-financial enterprises rose 3.8% y/y, down 1.5 pps from April, reaching their lowest growth rate since 2016.
China’s yuan has strengthened to a near three-year high, reaching 6.4 per dollar on June 21st, boosted by a falling dollar. It has also been buoyed in recent months by the country’s rapid recovery from the pandemic, and by a rush of international investment into China’s relatively high-yielding markets. Chinese stocks also jumped, thanks partly to a surge in foreign buying. A strengthening yuan will bring the current strong exports back to normal. The yuan might still appreciate further with China’s relatively tight monetary policy, in contrast to global monetary loosening, such as the almost zero interest rate in the United States. China’s tightening monetary policy is hardly likely to change, in the face of future global inflation spillover risk.


Growth is stable. Industrial output was up 9.8% y/y in April, and up 14.1% y/y from April 2019, with annualized growth of 6.8% y/y, the same as in Q1, and higher than the pre-pandemic levels in 2018 and 2019. Investment is still weak, and rose 8% y/y from April 2019, with an annualized growth rate of 3.9% y/y, up 1.3 pps from Q1. We expect economic growth to be strong, though fiscal and monetary policy are not loosening. Our forecast is based on strong trade growth from global economic recovery, commodity price appreciation and demand recovery.
Consumption recovered slowly. In April, price-adjusted consumption grew 5.4% y/y from April 2019, with an annualized growth rate of 2.7% y/y. Trade in April continues to be strong. Exports rose 22.2% y/y, up 11 pps from Q4 2020. Imports rose 32.2% y/y, up more than 20 pps from Q4.
Producer prices continue to grow faster. In April, the ex-factory price index of industrial output rose 6.8% y/y, and PPI increased 9% y/y, approaching the peak point in Q1 2017. CPI rose 0.9% y/y, up 0.5 pps from March. Most financial and monetary indicators grew more slowly. At the end of April, M2 rose 8.1% y/y, down 2 pps from the end of 2020. M1 rose 6.2% y/y, down 2.4 pps.
China’s once-in-a-decade population census, with preliminary results announced on May 12th, showed the slowest population growth rate since the 1950s, notwithstanding the relaxation of the one-child policy to a two-child policy in 2016. The census also showed that more Chinese people were moving away from the poorer northeastern part of the country, and to the wealthier eastern and southern regions. For example, Shenzhen and Guangzhou, already among the largest cities previously, gained the most, of 7.13 million and 5.98 million people. The migration to richer and more productive cities, made possible by the relaxation of Hukou, provides a key growth source, simply because labor can be utilized more efficiently.
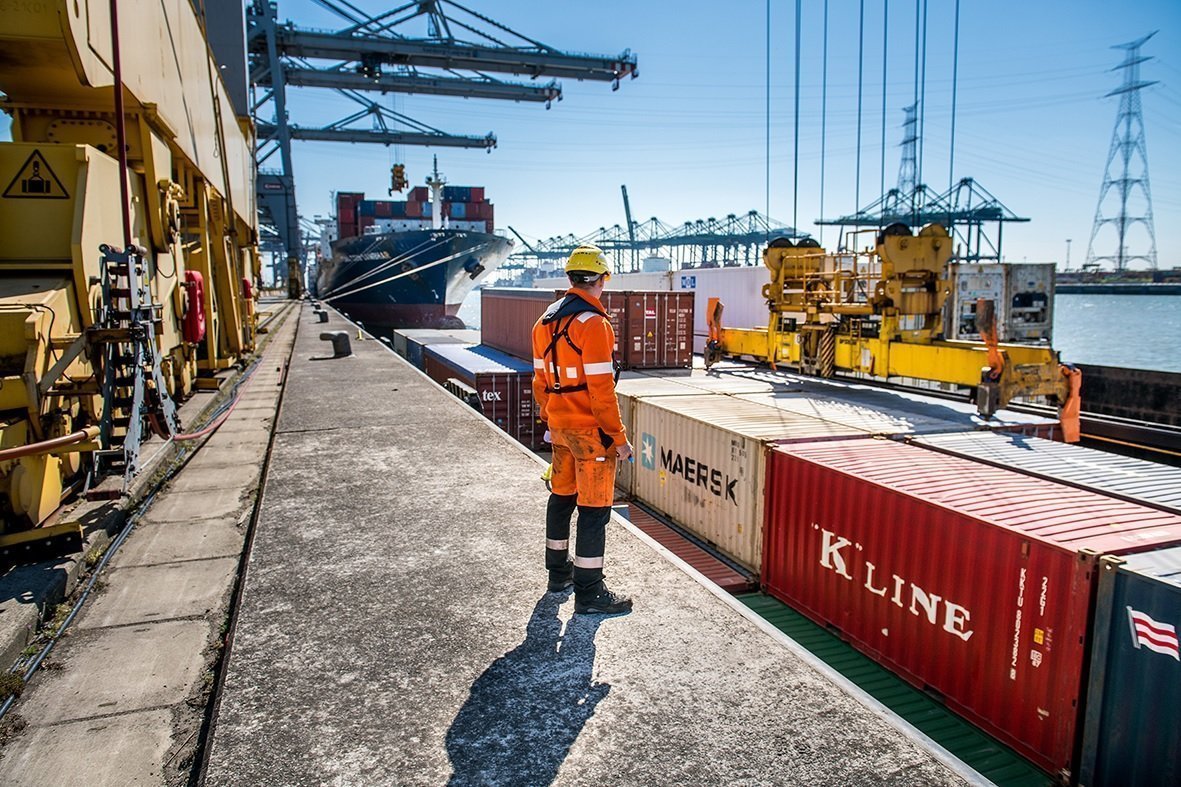
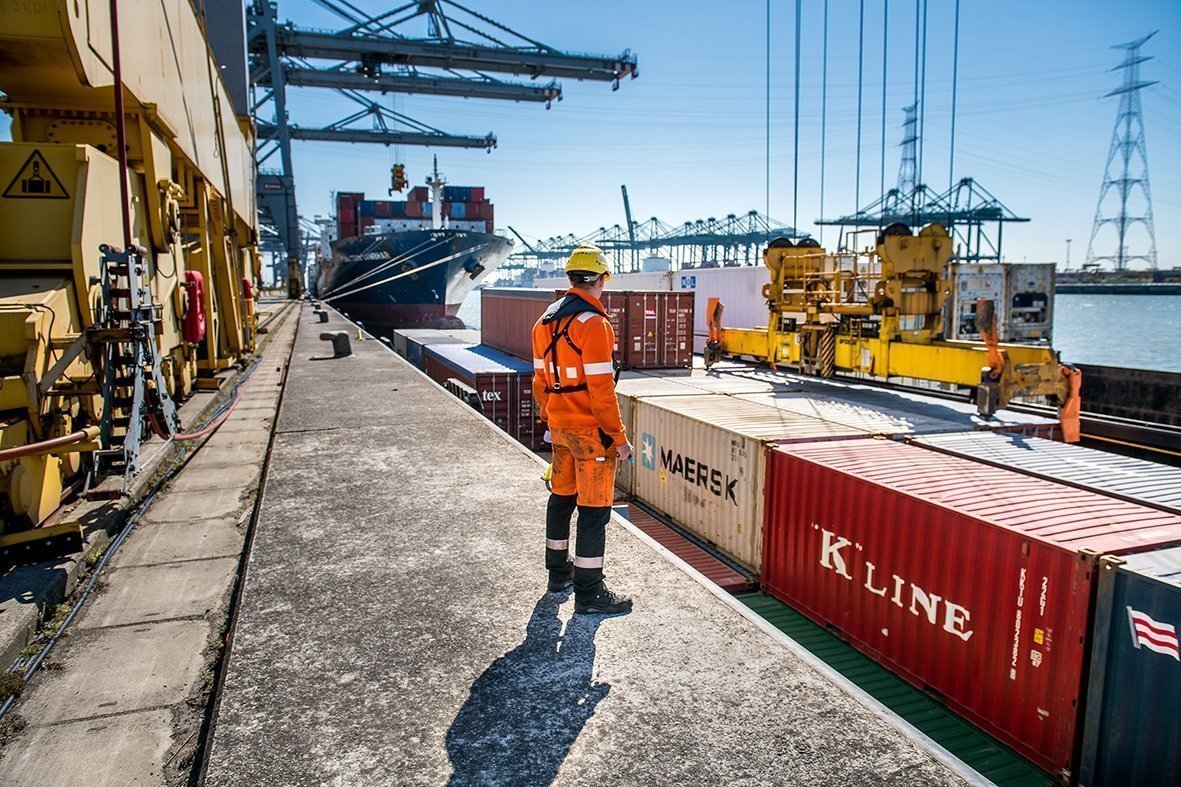
GDP was up 18.3% y/y in Q1, and up 10.3% from Q1 2019, with an annualized growth rate of around 5%. In this report, we mostly use Q1 2019 as the benchmark period, because the major shock from the pandemic in February 2020 makes Q1 2020 data hardly comparable. The adjusted growth rate was lower than in Q4 2020, and higher than in Q3 2020, and can be viewed as stable.
In Q1 2021, industrial output was up 14% y/y from Q1 2019, with annualized growth of 6.8%, slightly lower than in Q4 2020. In particular, industrial growth in March reached 12.8% y/y, with an annualized growth rate of 6.2% y/y, up 0.4 pps from Q3 2020. In Q1, investment rose 25.6% y/y, and increased only 5.4% from Q1 2019, with an annualized growth rate of 2.6%, much lower than in H2 2020.
In Q1, retail sales of social consumption goods rose 33.9% y/y, and were up 8.5% from Q1 2019, with an annualized growth rate of 4.1%, indicating that consumption is still on its way to recovery. In Q1, imports rallied, and grew 19.2% y/y, up 19.3 pps from Q4 2020. Exports increased 16.5% from Q1 2019. The adjusted growth rate is comparable to H2 2020, and is at high levels for recent years.
In Q1, producer prices continue to increase, and the growth rates are high. In March, the ex-factory price index and PPI saw growth reach 4.4% and 5.2% y/y, up 4.8 pps and 5.2 pps from December 2020. This is mainly driven by strong demand for commodities from other countries’ economic recoveries. CPI is instead basically stable. Money and financial indicators grew more slowly. At the end of March, M2 was up 9.4% y/y, down 1.5 pps from its peak last year. M1 was up 7.1% y/y, and has decreased 2.9 pps over four consecutive months.
Postponing the retirement age will be on the Chinese government’s agenda, according to announcement made March 22nd, with further details released on April 13th. China’s aging problem is severe, and population growth is on a steep declining trend, and has attracted great attention. The takeaway from the statement on postponing retirement age is that the delay is to be gradual, and experimental. It will alleviate the negative effects of slower population growth. Population aging and slower growth mainly negatively affect GDP, but not necessarily in per capita terms, due to China’s high savings rate, and financially rich central government.
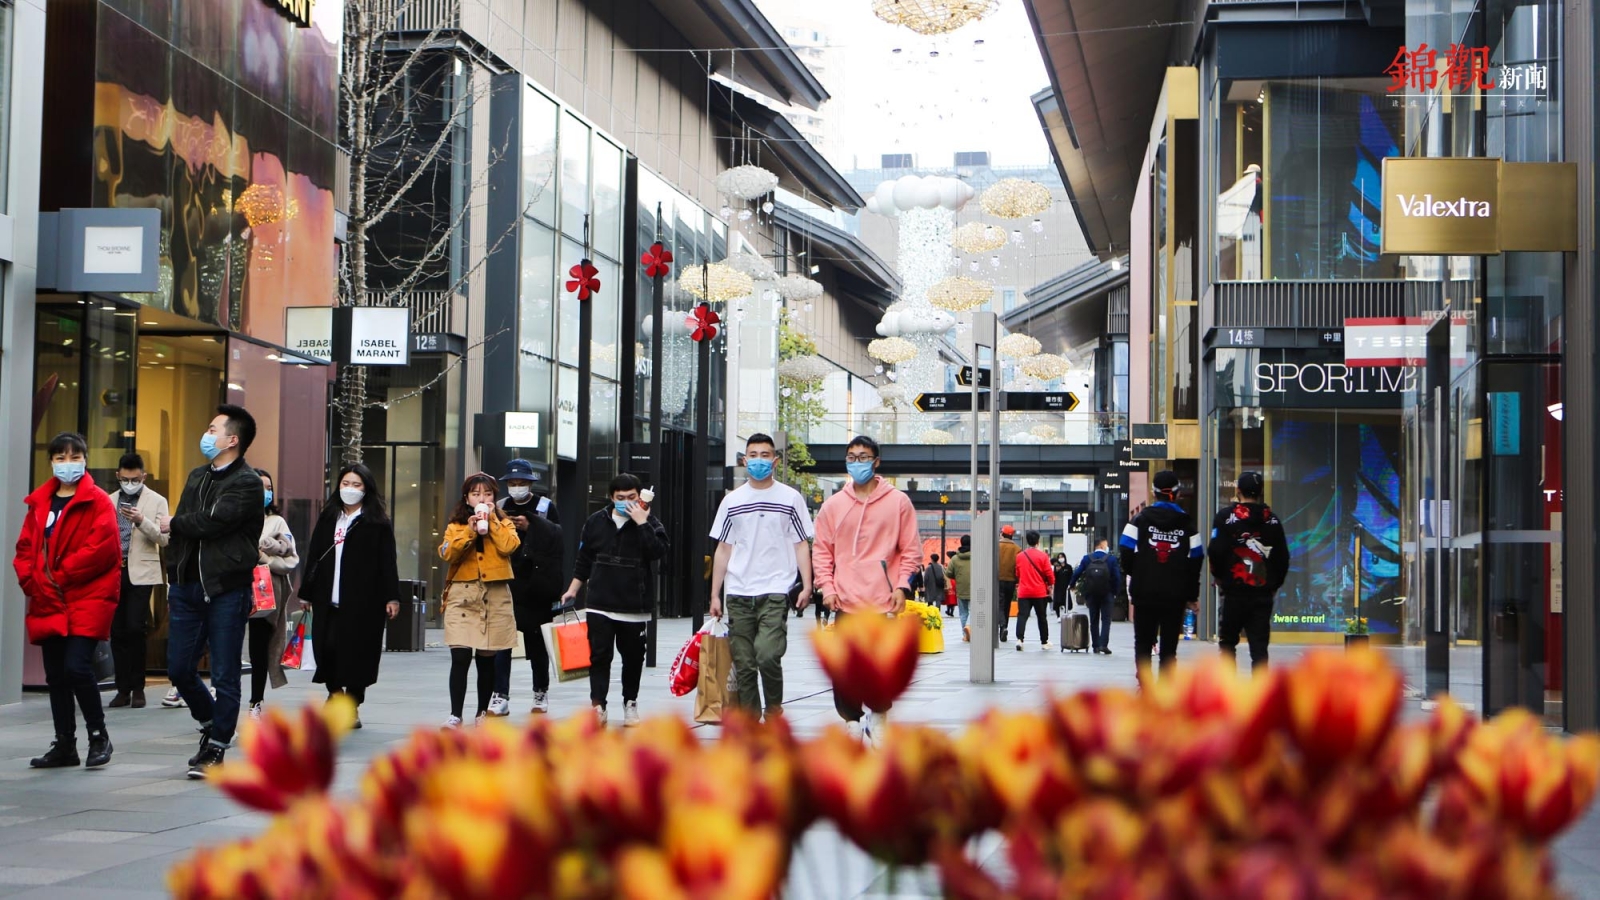
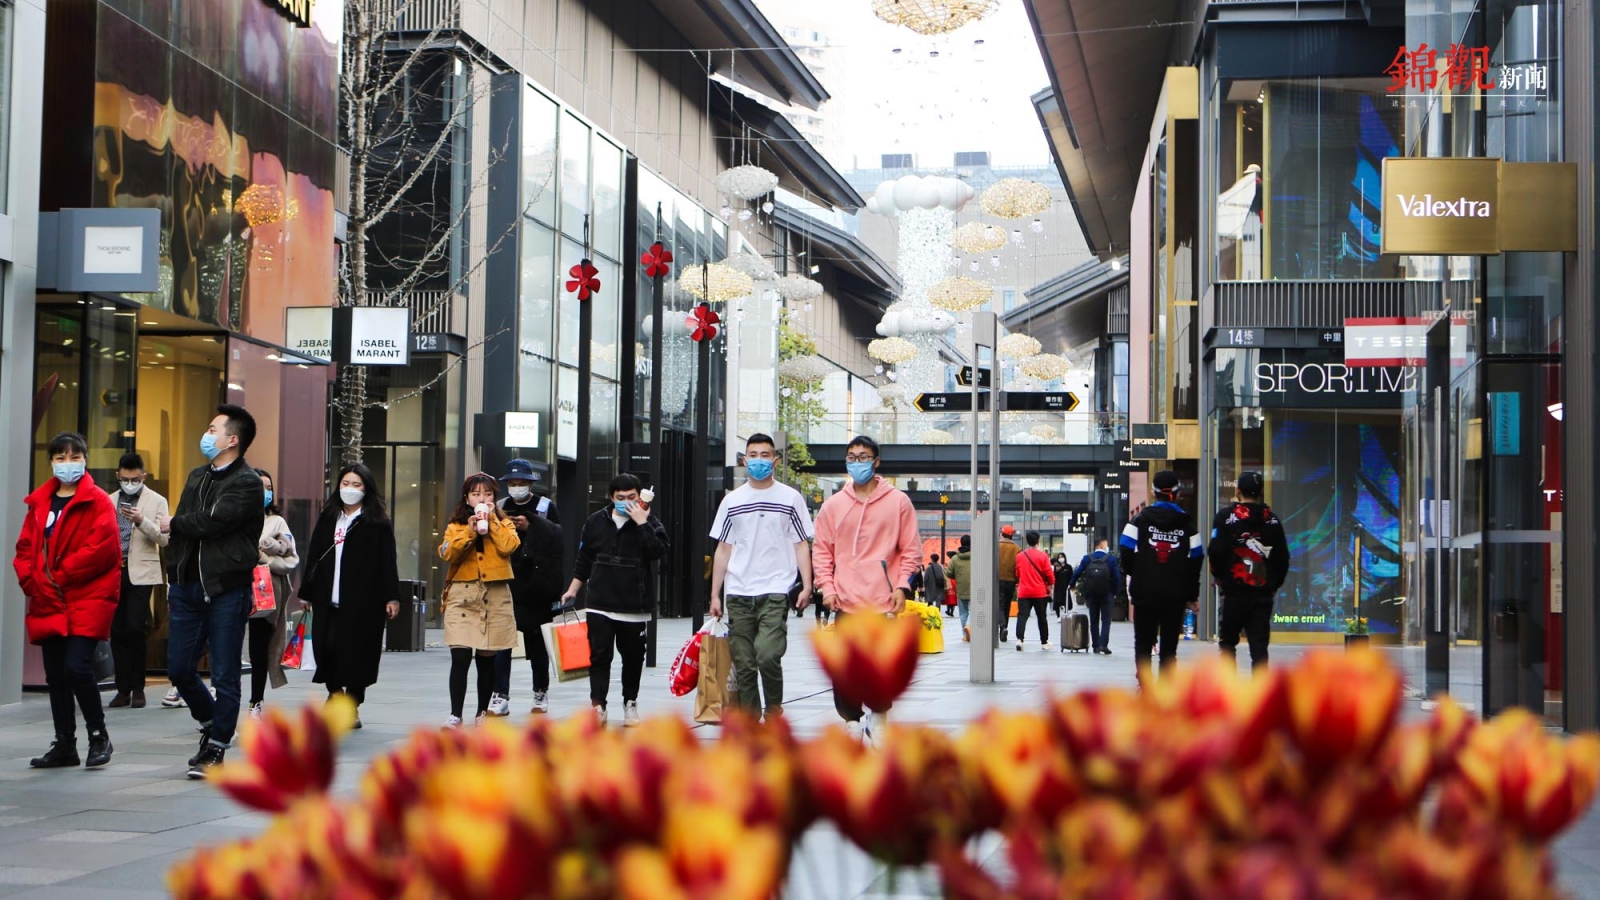
Economic recovery is still going strong. In January-February, industrial output was up 35.1% y/y, and up 16.9% compared to January-February 2019. Annualized growth was 8.1% y/y, higher than all quarterly growth since 2015, and up 1 pps from Q4 2020. Since the Chinese economy was shut down to a large extent last February due to COVID-19, we also look at growth rates for most indicators by comparing their performance with the same period in 2019.
In January-February, investment fell -35% y/y, and was up only 3.5% y/y from the same period in 2019. The investment slowdown is mostly due to the central government’s intention to cool the economy.
Trade is strong, as we forecast. In January-February, exports were up 50.1% y/y, and increased by 26.2% from same period in 2019, and up 9 pps from Q4 2020. Imports were up 14.5% y/y. The adjusted growth rate was around 12% y/y, up 12.1 pps from Q4.
Producer prices rose faster. In February, the ex-factory price index of industrial goods was up 1.7% y/y, and up 1.4 pps from January. The PPI was up 2.4% y/y, and up 1.5 pps from January. The CPI fell -0.2% y/y, up 0.1 pps from January. Monetary policy has returned to normal. At the end of February, M2 was up 10.1% y/y, the same rate as the end of last year, and down 1 pps from the peak last year. M1 rose 7.4%, down 2.6 pps from the peak last year, and it has declined rapidly since November.
Consumption is the only weak indicator. In January-February, retail sales of social consumption goods were up 33.8% y/y, up 6.4% from same period in 2019, and up 1.8 pps from Q4 2020, indicating consumption demand is still on a path of recovery.
On March 23rd, Premier Li Keqiang said that China’s economic growth this year could exceed a target of “above 6%,” with the government seeking stable expansion and job creation, emphasizing consumption. Consumption inequality, which is closely related to income and wealth equality, rose last year. With the premier’s effort and return to normal monetary policy, we believe consumption as well as the much-related imports will rise this year.


Producer prices increased fast between June 2020 and January 2021, and finally turned positive. The ex-factory price index of industrial goods rose 1% m/m, and 0.3% y/y. PPI rose 1.4% m/m, and 0.9% y/y. We expect the ex-factory price index to soon rise higher than 5% y/y, and PPI will rise higher than 8% y/y.
CPI fell -0.3% y/y. However, its seasonally adjusted growth rate was 0.3% m/m. The rise of the CPI level is mainly driven by the strong rebound of meat prices. The rebound is temporary, and linked to the Spring Festival effect. We expect the meat price will continuously drop for the next few months, and for CPI growth to slow as well.
Monetary and financial indicators cooled further. In January, M2 rose 9.4% y/y, down 0.7 pps from December. M1 rose 14.7% y/y, and 10% y/y after taking out the Spring Festival effect. RMB loans from financial institutions rose 12.7% y/y, down 0.1 pps from December. Savings deposits from non-financial institutions rose 15.8% y/y and deposits’ adjusted growth rate was lower than 12% y/y. Because the broad money supply was not affected by the Spring Festival effect, their growth rate declines show that the overall money and financial situation continue their declining trend.
PMI fell. In January 2021, PMI was 51.3%, down 0.6 pps from December 2020. The non-manufacturing business activity index was 52.4% y/y, down 3.3 pps from December. The two indexes show that expansion trends for both manufacturing and non-manufacturing industries have slowed.
Chinese exports have been strong since 2020. For example, China overtookthe United States as Europe’s top trade partner in 2020. Even though pandemic-related goods comprise a sizable share, other categories’ exports are also rising. Strong export growth, with production interruption in the rest of the world because of the pandemic, shows China’s economic resilience. The resumption of overseas production, if the pandemic is under control, will lift Chinese exports of capital and intermediate goods. Moreover, the import demand from the United States had been strong since 2020, and will likely be large, given the incoming stimulus. In sum, robust export performance will persist, and we expect export growth in the first half of 2021 to be 16%.


Industrial output rose 7% y/y in November, reaching its fastest growth rate since April. Investment rose 2.6% y/y, and was up 0.8 pps from October.
Consumption was the worst-hit macro variable of the pandemic. But retail sales of consumer goods recovered further, rising 5% y/y, up 0.7 pps from October. Its real growth rate was 6.2% y/y, and was even higher than in November 2019.
CPI fell -0.5% y/y in November, turning negative for the first time, hit by a fall in pork prices. The ex-factory price index of industrial output fell -1.5% y/y, and PPI fell -1.6% y/y, up 0.6 and 0.8 pps respectively from October.
Most financial and monetary indicators halted their rising trends, except for M1. As of the end of November, M1 was up 10% y/y, and up 0.9 pps from October, reaching its highest growth rate since February 2018.
Exports are surging, and rose 14.9% y/y, and 4.7 pps from Q3. Exports to the United States and Canada were particularly strong, rising 38.6% and 52.4% y/y, up 19.4 pps and 23.2 pps from Q3. Imports fell -0.8% y/y, turning negative again, although by a small magnitude.
China’s exports in November experienced their strongest surge since early 2018: China shipped $268 billion in goods, more than 21% more than in the same month last year, pushing its trade surplus to a monthly record high of $75.4 billion. China’s global export share increased to over 13% in the second and third quarters from 11% last year, the highest for any quarter. All this happened despite a strong RMB. This can be mostly attributed to China’s good pandemic control, which allowed production to proceed uninterrupted, in comparison to other major economies.
In October, industrial output rose 6.9% y/y, the same rate as in September, and the highest rate this year, up 2.2 pps from October 2019. The national service production index has been rising since the economic opening in February, and achieved positive growth in May. It rose 7.4% y/y in October, up 2 pps from September, and up 0.8 pps from October 2019. Investment rose 1.8% y/y in October, up 1 pps from September.
Retail sales of social consumption goods recovered further, and were up 4.3% y/y, and up 3.4 pps from Q3. Their real growth was 4.6% y/y, up 5 pps from Q3.Even the pandemic’s hardest-hit restaurant income has avoided a fall, and was up 0.8% y/y.
Price rises tempered amid monetary expansion. In October, CPI growth fell to only 0.5% y/y, mostly pulled down by significant meat price drops. After adjusting for seasonal factors, CPI fell -0.4% m/m. We expect CPI growth to turn from positive to negative next month, and that this will be a trend for the near future. The ex-factory price index of industrial goods fell -2.1% y/y. PPI fell -2.4% y/y. M1 rose 9.1% y/y, up 1 pps from September, and up 5.8 pps from last October, reaching its highest growth rate since February 2018.
In October, exports rose 7.6% y/y, and imports rose 0.9% y/y. Both of their seasonal adjusted growth rates show upward trends. We expect the appreciation of RMB and economic recovery to bring higher import growth.
On November 15th, 2020, 15 countries — members of the Association of Southeast Asian Nations (ASEAN), and Australia, China, Japan, South Korea and New Zealand signed the Regional Comprehensive Economic Partnership (RCEP), arguably the largest free trade agreement in history. This is the first time China has signed up to a regional multilateral trade pact. This is an example of China’s commitment to the greater openness repeatedly advocated by President Xi Jinping. While the trade deal certainly will boost these countries’ economies in the short term, in the long term it is "a victory of multilateralism and free trade," as Prime Minister Keqiang Li put it, in contrast to U.S. President Donald Trump’s trade policy.


GDP was up 4.9% y/y in Q3, a rise of 1.7 pps from Q2, but still 1.1 pps lower than in Q3 2019. Industrial output was up 5.8% y/y in Q3, up 1.4 pps from Q2, and up 0.8 pps from Q3 2019.
Investment was up 8.8% y/y, up 5 pps from Q2, and up 4.1 pps from Q3 2019, with investment in manufacturing rising fastest, by 9% y/y, up 10 pps from Q2. Retail sales of social consumption goods were up 0.9% y/y, and up 4.8 pps from Q2 -- and their real growth rate was -0.4% y/y.
CPI was up 2.3% y/y in Q3, down 0.4 pps from Q2. In particular, CPI rose only 1.7% y/y in September, an accelerated decrease. Producer prices fell less. The ex-factor price index of industrial goods fell -2.2% y/y, up 0.9 pps from Q2. PPI rose 1.2% m/m. It fell -2.7% y/y, up 1.7 pps from Q2.
The societal financing scale increased 46% y/y, driven by booming government bond issuance. The main financial indicators have stable or slightly increasing growth rates. At the end of Q3, M2 was up 10.9% y/y, down 0.3 pps from June. Household savings rose 13.9% y/y, down 0.4 pps from June. M1 was up 8.1% y/y, up 1.7 pps from June.
Despite the global pandemic, and the still ongoing U.S.-China trade war, exports are surging, and rose 10.2% y/y, up 5.7 pps from Q2, and up 6.3 pps from Q3 2019. The Chinese share of world exports also climbed, to 20%, from 13.1% in 2019, and 12.8% in 2018. Specifically, exports to the United States rose 19.2% y/y. Imports increased 4.3% y/y, up 10.1 pps from Q2.
The RMB has been appreciating against the dollar since June. On October 26th, the RMB had appreciated 6.7% compared to its value at the end of May. However, the magnitude is still too small to have sizable impacts on trade.
The export surge can be attributed to China’s good pandemic control, and its economy’s high resilience. Based on these two factors, we expect exports will remain in good shape in the near future.


Industrial output was up 5.6% y/y, up 0.8 pps from July, reaching the average growth rate of 2019. We expect growth might slightly exceed the pre-pandemic level for the rest of the year. Investment fell -0.3% y/y January-August, up 1.3 pps from previous months. The driving force is switching from state to private investment, reconfirming the return to pre-pandemic economic recovery.
Consumption was up 0.5% y/y, the first turn to positive growth this year, and up 1.6 pps from July. Exports were up 11.6% y/y, above 10% y/y for two consecutive months. Despite the U.S.-China conflict, exports to the United States grew faster than 20% y/y. Imports fell -0.5% y/y.
CPI growth turned downward in August, and was up 2.4% y/y, falling to the pre-pandemic level. For the next three months, based on the high base numbers of 2019, CPI is expected to fall further. Producer prices continued to rebound. The ex-factory price index of industrial goods fell -2% y/y, and PPI fell -2.5% y/y, up 0.4 and 0.8 pps from July, respectively. But both are still -1.6% and -2.2% y/y lower than in 2019.
The main financial indicators displayed differing patterns in August. M2 was up 10.4% y/y, falling for two consecutive months, and down 0.7 pps from June. M1 rose 8% y/y, up 1.1 pps from July, maintaining its upward trend. The societal financing scale rose 63.1% y/y, mainly driven by large government bond issuance.
The Chinese RMB has strengthened by 2.5% against the dollar in the last four weeks. Cross-border RMB receipts and payments totaled 12.67 trillion yuan, up 36.33% y/y. We expect the RMB will further strengthen in the rest of the year, given the Chinese economy’s much better comeback compared to the United States, the large interest rate differential between the United States and China, and the U.S. dollar flooding into the market. Even though the RMB cannot overtake the dollar in the international market in the near future, the outlook for the RMB is promising.


Industrial output rose 4.8% y/y in July, the same rate as in June, down 1.1 pps from Q4 2019. Investment grew 8.3% y/y, up 2.7 pps from June, and up 2.9 pps from Q4, and is still mainly driven by state investment, with a growth rate of 12.7% y/y. The best performer among fixed asset investments is real estate, with a growth rate of 11.6% y/y in July, up 3.7 pps from Q2.
Consumption is still weak, and was down -1.1% y/y, and up 0.7 pps from June, showing customers’ caution over COVID-19. In July, exports grew 10.4% y/y, up 6.1 pps from June, and up 6.4 pps from H2 2019, possibly due to the halt of overseas production. Imports are fluctuating significantly, and aren’t showing any trend. They rose 1.6% y/y, down 4.6 pps from June.
Producer price growth is trending up. The ex-factory price index of industrial goods rose 0.4% m/m and fell -2.4% y/y. PPI rose 0.9% m/m, and fell -3.3% y/y. Growth of the two indices is down 0.6 and 1.1 pps from June. But we expect future producer prices to at most rebound to their pre-pandemic growth rate levels. CPI rose 2.7% y/y, up 0.2 pps from June. We expect its rise to be temporary.
Major financial indicators have been falling, or flat. M2 rose 10.7% y/y, down 0.4 pps from June. Loans rose 13% y/y, down 0.2 pps from the end of June. M1 grew 6.9% y/y, up just slightly, by 0.4 pps.
On August 14th, a pioneering digital currency initiative initiated by the People’s Bank of China stated that that it would expand the trail program to a number of large cities, with the involvement of the big four state banks. China’s Alibaba has already entered into a “strategic partnership” with the Central Bank over the sovereign digital currency plan. We view digital currency reform as part of the Chinese government’s grand Fintech plan. It will make financial transactions easier, by reducing the intermediary role of commercial banks, directly benefiting small and medium-sized firms.


GDP rose 3.2% y/y in Q2 -- a remarkable performance amid global pandemic. In June, industrial output was up 4.8% y/y, and up 0.4 pps from May, though has still not reached the pre-pandemic level, and was down 1.1 pps from Q4 2019. Investment, mostly driven by state investment, was up 5.6% y/y, up 1.7 pps from June and down 0.2 pps from Q4 2019.
Retail sales of consumption goods fell -1.8% y/y in June, up 1 pps from May. Exports rose 4.1% y/y in June, achieving positive growth for three consecutive months, averaging 4.5% y/y, higher than the growth rate of H2 2019. Imports were up 6.2% y/y, turning positive for the first time.
The ex-factory price index of industrial products fell -3% y/y in June, and PPI fell -4.4% y/y, up 0.7 and 0.6 pps from May, respectively. CPI slightly rebounded, rising 2.5% y/y, up 0.1 pps from May, and increased 0.4% y/y, after removing the seasonal factor.
The main financial indicators were still strong in June. M2 rose 11.1% y/y, the same rate as in May. The still-increasing adjusted M1 rose 7.3% y/y. Savings deposits from non-financial institutions were up 13.2% y/y.
The market has seen a steady increase in money market rates since early May, and the highest 10-year sovereign bond yield in five months. And although People’s Bank of China Governor Yi Gang signaled a fresh liquidity injection two weeks ago, it is taking an unusually long time to be delivered. We expect the strong growth rebound has made monetary loosening exit early. This is partly in order to avoid asset bubbles, in line with the recent housing price surge in major cities like Shenzhen, where housing prices have risen 20% over the past two months, and as seen in the stock market rally.


Industrial output rose 4.4% y/y in May, up 0.5 pps from April, comparable to its pre-pandemic level, and was down just 1.5 pps from Q4 2019. Investment was up 3.9% y/y, and up 3.1 pps from April, down 1.5 pps from Q4. Government investment is the main force lifting overall investment growth.
Consumption demand continued to recover in May. Retail sales of social consumption goods fell 2.8% y/y, up 4.7 pps from April. The global pandemic is not showing any sign of abating, and is heavily impacting trade. In May, exports were up 1.4% y/y, down 6.8 pps from April, while imports plunged 12.7% y/y.
Prices are all falling, creating conditions for future money expansion. The CPI rose 2.4% y/y, down 3 pps from January, mainly driven by food prices. Producer prices fell further. The ex-factory price index of industrial goods decreased 3.7% y/y, and the PPI fell 5% y/y, down 0.6 and 12 pps respectively from April.
Monetary policy is expanding. Major financial indicators all show upward trends. At the end of May, M2 was up 11.1% y/y, and M1 up 6.8% y/y, up 2.3 and 2 pps from the end of February.
On June 12th, Beijing reported its first local coronavirus case, after more than 50 days with zero new locally-transmitted cases. A total of 236 new confirmed cases had been recorded by the writing of this report. Even though such numbers seem insignificant, much evidence shows that COVID-19 might be entering a second phase. This has significantly increased public, and investor, sentiments of uncertainty. Our own survey data shows that 30% of Chinese people believe this virus will persist for a long time. Factoring in the worsening global situation, we are revising downward our GDP growth forecast to 1.4%, which is below other major forecasts, such as that of the IMF.


The National Committee of the Chinese People's Political Consultative Conference (CPPCC) convened the annual two sessions on May 21st. Although for the first time the government did not set an annual growth target - possibly due to so many COVID-19 uncertainties ahead - we expect the implicit growth target is 1.8% for now, given the projected deficit and inflation numbers.
The economy is quickly recovering, as the pandemic has come under control. In April, industrial output growth turned positive, and was up 3.9% y/y, and up 5 pps from March, down only 2 pps from the pre-pandemic level, in Q4 2019. Investment was up 0.8% y/y, and up 10.3 pps from March, mostly driven by expansionary state investment.
Consumption decreased less. Retail sales of consumption goods fell 7.5% y/y, up 8.3 pps from March. Exports were 4% y/y, comparable to the pre-pandemic level. Imports fell 6.1% y/y after seasonal adjustment, down 5.4 pps from Q1. Decreased imports are in line with overall weak domestic demand.
CPI was up 3.3% y/y after seasonal adjustment, down 1 pps from March. We expect CPI to fall further this year, led by large declines in food-related categories.
Monetary policy shows strong support for the economy. M2 was up 11.1% y/y, and M1 increased 5.5% y/y, up 1 and 0.5 pps from March. RMB loans from financial institutions were up 13.1% y/y, up 0.4 pps from the end of March.
China’s housing prices rose at a slightly faster pace in April. According to the National Bureau of Statistics (NBS), average new home prices in 70 major cities rose 0.5% in April from March, a pace not seen since October 2019, and following a 0.1% increase in March. The strong housing market lends support to macroeconomic and financial stability; for example, around 50% of loans in China are directly or indirectly linked to the real estate market. Strong housing investment also shows investor confidence amid domestic pandemic and global economic uncertainties, a key factor furthering the overall recovery.


The Chinese economy was hit hard by the coronavirus in Q1, and GDP fell -6.8% y/y. Because the virus is almost contained in China, economic activities have since March been gradually picking up, and there were clear signs of recovery. Industrial output was down -1.1% y/y, up 12.4 pps from January-February.
Consumption has been hardest hit, largely due to quarantining. Retail sales of social consumption goods fell -19% y/y in Q1, and -15.8% y/y in March, up 4.7 pps from January-February. Trade has so far been largely unaffected. Exports in March were up 2.8% y/y after adjustment, down only 1.4 pps from Q4 2019. Imports were up 2.4% y/y, down 2.8 pps.
Fixed asset investment has been left as the only major factor to keep the economy afloat, because of future weakening overseas demand, and of domestic consumption demand. By March, investment had not recovered to normal levels, falling -9.5% y/y, up 15 pps from January-February.
CPI eventually fell, and was down -0.6% m/m after adjustment, and up 4.3% y/y in March, down 1 pps from January-February. The ex-factory price index of industrial goods fell -1% m/m, and was down -1.5% y/y. PPI fell -1.1% m/m, and was down -1.6% y/y. Major financial indicators are the only ones not negatively impacted. M2 rose 10.1% y/y, and M1 rose 5% y/y, up 1.4 and 0.2 pps respectively from the previous month.
On April 17th, President Xi Jinping chaired a major meeting of the Politburo, China’s highest policy decisionmaking body, which promised to step up the magnitude of policies to achieve the country’s goal of “six stabilities:” stable employment, trade, financial markets, investment, foreign capital and expectations, on the condition that the virus has been effectively controlled. We believe there will be expansionary monetary and fiscal policies, such as interest rate cuts and accelerated infrastructure construction, but not a mass flooding to the market, per the approach of the Fed. Unlike in other major economies, China has been saving for rainy days to make these policies feasible, with its still-sizable gap with a zero interest rate, low central government debt, sizable state-controlled economy meaning non-cyclical unemployment, implicit social security system meaning unemployed migrant workers still possessing agricultural lands, and a high household saving rate.


The coronavirus outbreak in China has had major short-term negative effects on production activities. However, as of March 18th, within China it is largely contained, with zero new cases. The total number of global infection cases outside China has now surpassed the total number of cases in China, and the number is expanding rapidly. Industrial output in China fell -13.5% y/y in January-February, and investment fell -24.5% y/y. But we believe these two major indicators -- especially investment -- will recover soon.
We believe the Chinese economy and finance may be relatively stable, and recover quickly, amid global turmoil. Many economic activities have already recovered to a large extent, thanks to the “Internet plus” program initiated by the state council two years ago, which allows employees to work at home. The Chinese Central Bank has a long way to cut before reaching a zero interest rate, leaving room for further monetary easing, while other major economies’ central banks, including the Fed, now have interest rates near or at zero. The partially state-owned feature of the Chinese economy enables the government to effectively adopt targeted economic policies, such as extending financial favoritism to SMEs.
Negatively impacted by the curfew, with malls and restaurants closed, retail sales of social consumption goods fell -20.5% y/y. In January-February, exports fell -15.9% y/y, down 20 pps from Q4 2019. Imports fell -2.4% y/y, down 7.6 pps from Q4. Even though we believe these major indicators will recover quickly, the worsening coronavirus situation in other countries will hurt trade. We don’t expect recovery to rebound to its pre-coronavirus level soon.
CPI rose significantly in January-February, by 5.3% y/y, and up 0.8 pps from December, due to transportation segmentation organized for the virus curfew. The collapse of major world commodities such as oil also negatively impacted Chinese producer prices. In February, the ex-factory price index of industrial goods fell -0.4% y/y, and PPI fell -0.5% y/y. Both indicators are continuing their declining trends.
The coronavirus, however, has not had the major impact on Chinese financial markets as it has on other production factors. Major financial indicators are mostly stable. At the end of February, M2 was up 8.8% y/y, the same as at the end of 2019, and M1 was up 4.8% y/y, or 0.4 pps.
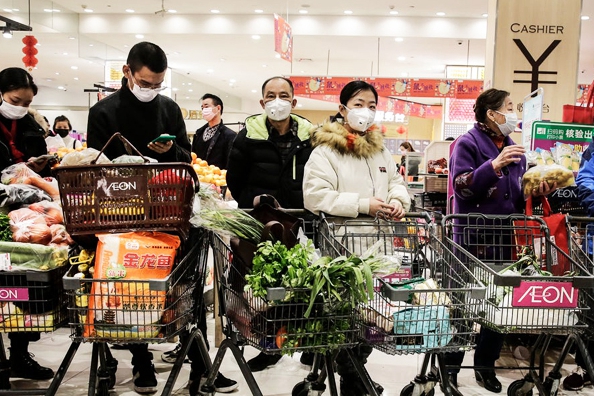
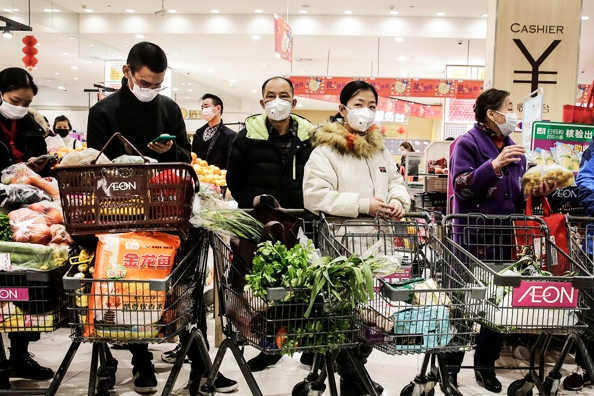
The coronavirus outbreak that began in late January was one of the most severe exogenous shocks in China’s recent history, especially since it overlapped with the Chinese New Year holiday, which involves the largest population migration in human history. As of February 26th, some 80,428 cases had been confirmed in China.
The Chinese government is using monetary and fiscal policies to boost the economy. On February 2nd, the People’s Bank of China pumped $174 billion into financial markets. As of this writing, the coronavirus has been largely contained, in terms of consistently lower numbers of new cases in China, due to the state’s strong capacity to enforce curfews, and because production is now being resumed. We are not as pessimistic as our peers, such as the Thomson Reuters aggregate survey, which forecasts 4.5% Q1 growth, as we expect to see at least 5% growth. We expect real estate, banking and transportation to be negatively affected, but believe the medical, infrastructure and health areas may be positively affected.
Because of the long Chinese New Year holiday, the statistics bureau, as usual in January, only announced price and financial data. The coronavirus won’t have any real effect on the economy in January, but its impact will show up in February data.
CPI was up 5.4% y/y in January, and up 0.9 ppts from December 2019. We expect the coronavirus to have a larger effect on February data, and to contribute to a higher CPI.
Producer prices were basically stable in January. The ex-factory price of industrial goods was the same as last month, and was up 0.1% y/y, and up 0.6 ppts. PPI fell -0.3% y/y, up 1 ppts from December, and 0.2% m/m.
The coronavirus has not yet shown a significant effect on financial indicators, and the main financial indicators have so far been basically stable. At the end of January, M2 was up 8.4% y/y, and down 0.3 ppts from the end of December. But M1 growth was down 4.4 ppts. Loans from financial institutions were up 12.1% y/y, down 0.2 ppts from December.
The United States and China on January 16th struck a "phase one" trade deal, at least easing uncertainty over the future of U.S.-China trade relations. Exports raised 5% y/y in 2019, down 2.8 pps from 2018, while imports raised 1.2% y/y, down 11.6 pps.
GDP raised 6.1% y/y last year, down 0.5 pps from 2018. Industrial output raised 5.7% y/y, down 0.5 pps, while investment raised 5.4% y/y, down 0.5 pps.
Fiscal revenue was up 3.8% y/y in January-November 2019, down 2.7 pps from the same period in 2018. Fiscal expenditure was up 7.7% y/y, up 0.9 pps. So the fiscal deficit is rapidly expanding, constraining government’s future fiscal expansion.
CPI was up 4.5% y/y in December, and up 2.6 pps from December 2018. Producer prices have been growing more slowly in 2019. PPI in December fell -1.3% y/y. PPI has been on its steepest decline since July 2016. The official PMI indicated contraction for a sixth straight month. Both reflect weak domestic demand due to growth slowdown. In response, for the first time since 2016, China on November 20th cut the interest rate on its one-year MLF loans by 5 basis points.
The annual Central Economic Work Conference (CEWC) held by top leaders December 10th-12th emphasized “stabilities.” We believe that “around 6%” is the likeliest 2020 growth target. The conference stated that the direction of housing policy in 2020 would be stable. We expect the stabilization policy to ease concerns of potential risks that real estate poses to the macroeconomy. Our confidence is based on China’s strong fundamentals, and strict real estate purchase restrictions.
On January 14th, the U.S. Treasury department dropped China’s designation as a “currency manipulator.” Onshore RMB instantly jumped by 0.2%, its highest level since July. Non-banks also showed net FX inflows of around $6 billion in December. We expect all of these indicators to improve significantly in 2020. Our faith is built upon China’s still-strong fundamentals, relatively peaceful U.S.-China relations in a U.S. election year, and China’s high capital return.


The annual Central Economic Work Conference (CEWC) held by top leaders December 10th-12th emphasized “stabilities.” We believe that “around 6%” is the likeliest 2020 growth target. Infrastructure investment was mentioned, suggesting that infrastructure spending will be used to support the economy, if growth slows notably below 6%.
The good news that “phase 1” of a China-U.S. trade agreement, which includes a reduction of U.S. tariffs on Chinese goods, and an increase of foreign investor access to China, may be signed in early 2020, has cheered the markets. There are more optimistic expectations for the global economy next year, although we may see a ceasefire rather than a peace treaty.
Growth was recovering in November, mostly due to a private investment boost. Industrial output was up 6.2% y/y, representing a strong recovery, and up 1.5 pps from October, and 1.2 pps from Q3. Investment was up 5.2% y/y, up 1.8 pps from October and up 0.5 pps from Q3. Private investment was up 6.9% y/y, and up 4.3 pps from Q3. The adjusted growth rate for retail sales of social consumption goods was 4.9% y/y, down 0.8 pps from Q3.
Imports were up 2.5% y/y in November, up 5.4 pps from Q3, temporarily escaping the negative growth zone. Exports were up 1.3% y/y, instead of down 2.6 pps, as happened in Q3. CPI was up 4.5% y/y in November, up 0.7 pps from October, and up 1.5 pps from September. CEWC conference speakers did not mention inflation. This indicates that the current high inflation, driven mostly by meat prices, is considered a micro issue, and won’t significantly influence future monetary policy changes. The ex-factory price index of industrial goods fell -1.4% y/y, up 0.2 pps from October. PPI fell -2.2% y/y, down 0.1 pps from October. M2 rose 8.4% y/y, down 0.2 pps from October. M1 rose 3.5% y/y, up 0.2 pps from October.
Housing prices have stabilized, after the 2015 and 2016 boom. The CEWC conference stated that the direction of housing policy in 2020 would be stable. People’s Bank of China Governor Yi Gang had also mentioned earlier a plan to apply countercyclical action to the real estate industry. Since real estate plays an important role in the Chinese economy, we expect the stabilization policy to ease concerns of potential risks that real estate poses to the macroeconomy. Our confidence is based upon China’s strong fundamentals, the fact that few alternative investment channels are available, and strict real estate purchase restrictions.
Major economic indicators are still mostly falling in October. Industrial output rose 4.7% y/y, comparable to July and August. Investment rose 3.4% y/y, down 1.3 pps from Q3. Retail sales of social consumption goods rose 7.2% y/y, and its real growth rate was 4.9% y/y, down 0.4 and 0.8 pps from Q3 respectively.
In October, exports rose 2.1% y/y, and imports fell -3.5% y/y, down1.8 and 0.6 pps from Q3. Export to US fell -13.8% y/y, but up 6.2 pps from September. Trade surplus is enlarging dramatically, and rose 36.6% y/y.
Since July, societal financing scale was slowing, and rose only 0.8% y/y in Q3, steeply falling from 40.6% and 22.4% y/y in Q1 and Q2 respectively. In particular, it fell -16.1% y/y. M2 was up 8.4% y/y, and M1 rose 3.3% y/yin October. Both are basically stable.
In October, CPI appreciated largely and rose 3.8% y/y, up 0.8 pps from September. The driving factor is only meat price. Meat price appreciation is publicly viewed as cyclical, and not sustainable. Ex-factory price index of industrial goods rose 0.1% m/m, and fell -1.6% y/y, down 0.4 pps from September.
The PPI, seen as a key indicator of corporate profitability, fell -1.6% in October from a year earlier, marking the steepest decline since July 2016. This aligns with other indicators showing shrinking manufacturing activity in October, with the official PMI indicating contraction for a sixth straight month. Both reflect weak domestic demand from growth slowdown and external demand from trade war. They also indicate future insufficient growth source. In response, on November 20th, China for the first time since 2016 cut the interest rate in its one-year MLF loans by 5 basis points. A future interest rate cut is constrained by the current high inflation.
The economy is showing various signs of weakening. In Q3, GDP was up 6% y/y, down 0.2 pps from Q2, and down 0.5 pps from Q3, 2018. Industrial output was up 5% y/y, down 1 pp from Q3, 2018. Investment was up 4.7% y/y, down 0.8 pps from Q2.
Retail sales of social consumption goods were up 7.6% y/y, down 1 pp from Q2, and down 1.4 pps from Q3, 2018. Sales’ real growth rate was 5.7% y/y, down 0.8 pps from both Q2 and Q3, 2018. Imports fell 2.9% y/y, down 5.2 pps from Q2, and down 21.9 pps from Q3, 2018. Exports rose 3.9% y/y, down 1.8 pps and 6.4 pps from Q2 and Q3, 2018 respectively. The trade declines were mainly caused by the weakening global economy, and trade war with the United States.
In Q3, CPI rose 2.9% y/y, up 1.1 pps from Q1, continuing its appreciation trend. Producer prices turned to negative growth. The ex-factory price index of industrial goods fell 0.8% y/y, and PPI fell 1.2% y/y, both down 1.3 pps from Q2. Higher CPI raised policymakers’ concern, leading to tightening monetary policy. At the end of September, M2 was up 8.4% y/y, the same as in June. M1 was up 3.4% y/y, down 1 pps from the end of June.
On October 23,the State Council announced 12 detailed measures to better facilitate cross-border trade and investment, including by improving foreign exchange management, and by further streamlining regulatory requirements, with a view to using a more enabling business environment to attract foreign investors. We believe these detailed plans complement the central leadership’s promise early this year of keeping China more open, in contrast to the rise of protectionism in some other countries. The plans are very detailed, and are expected to have an immediate positive impact on trade and foreign investment, and therefore on aggregate economic growth.


Growth is slowing further. In August, industrial output was up 4.4% y/y, down 0.4 pps from July, while investment rose 4.2% y/y, down 1.3 pps from Q2.
Retail sales of social consumption goods were up 7.5% y/y in August, down 1.1 pps from Q2. The indicator’s real growth rate was 5.6% y/y, down 0.9 pps from Q2. Exports were stable, but the import growth rate was plunging. Exports were up 2.6% y/y. Yet recent export growth was rather volatile. The July-August combined growth rate was 5.9% y/y, almost the same as in Q1 and Q2. The much lower export growth to the United States was compensated for by exports to ASEAN countries, and to Taiwan. Imports fell -2.6% y/y, down 4 pps from H1.
CPI was up 2.8% y/y in August, the same rate as in July. Its main components, however, changed significantly, with pork prices skyrocketing due to the sharp reduction of production caused by the previous spread of African swine fever. At the same time, producer prices fell further, and the growth rate turned negative. The ex-factory price index of industrial goods fell -0.8% y/y, and PPI fell -1.3% y/y, down 0.5 and 0.7 pps from July. The major decline in growth rates is mainly due to last year’s high base numbers. We expect this decline to slow by the end of this year. Principal financial indicators are largely stable. At the end of August, M2 was up 8.2% y/y, close to its July rate. M1 was up 3.4% y/y, up 0.3 pps from July.
On September 10th, the State Administration of Foreign Exchange (SAFE) removed the investment quota limitations on two inbound investment schemes: the Qualified Foreign Institutional Investor (QFII) program, and the RMB Qualified Foreign Institutional Investor (RQFII) program. On September 23rd, Standard & Poor's Dow Jones indices included China A-Shares to S&P DJI's Global Benchmark Indices, after the MSCI index’s inclusion. The index company’s response to the inclusion attributed the sole reason to overseas investors’ increased interest in the Chinese market. The bond market also exhibits this internationalization trend this year, such as via the Bloomberg index’s inclusion of the China bond market. Institutional investors with careful analytical tools run contrarily to the negative trade war sentiment. More financial integration will improve China’s capital allocation and market efficiency. This also benefits Chinese firms, by lifting their competitiveness both directly and indirectly, and will increase their internationalization.
Growth slowed in July. Industrial output was up 4.8% y/y, down 0.4 pps from both April and May, falling to a record low rate. The main causes were low investment and consumption, sentiment mostly driven by “trade war.” Investment was up 5.1% y/y, down 0.4 pps from Q2, and down 2.4 pps from Q4 2018, a clear declining trend. Retail sales of consumer goods were up 7.6% y/y in nominal terms, down 1 pps from Q2. Their real growth rate was 5.7% y/y, down 0.8 pps from Q2.
Though trade tensions persist, imports fell more than exports. Imports in dollar terms fell -5.9% y/y, more than in either Q1 or Q2. Exports rose 2.8% y/y, up 1.4 pps and 4.4 pps from Q1 and Q2, respectively. The direct contribution of net exports to GDP was positive, reconfirming our view that trade war “noise” affects China mainly via sentiment.
Producer prices fell. The ex-factory price index of industrial goods fell -0.3% y/y, and -0.2% m/m. This is the first negative growth since September 2016. PPI fell -0.6% y/y in July, and decreased -0.2% m/m, down 0.3 pps from June. We forecast PPI to decline further, but by a moderate magnitude. CPI rose 2.8% y/y, up 0.1 pps from June. CPI is not expected to rise higher. Main financial indicators fell. M2 rose 8.1% y/y, M1 was up 3.1% y/y, down 0.4 and 1.1 pps from June.
On August 5th, after a Tweet by U.S. President Donald Trump, the U.S. Treasury Department announced it would label China a “currency manipulator.” That day the yuan dropped to below 7 to the dollar, for the first time in over a decade (although the magnitude of the drop was small, as the yuan has hovered around 6.9 for a significant amount of time). Our data shows that the yuan has experienced several similar depreciations in recent years. The “currency manipulator” label seems baseless, according to the United States’ own unilateral standards. But Trump’s accusation is understandable, because Trump is viewed through the prism of huge re-election pressure, and wants a deal before the election. So the Chinese government is simply waiting. Yuan depreciation should be temporary, as it’s driven by the negative sentiment of trade war. In the long term, fundamentals point to a more or less stable yuan.


GDP rose 6.2% y/y in Q2, down 0.2 pps from Q1. Industrial output rose 5.6% y/y, down 0.9 pps, but notably, was up 6.3% y/y in June, obviously higher than in April and May. We judge the unusually high June growth to be a seasonal phenomenon, and unsustainable.
Fixed asset investment was up 5.5% y/y, down 0.8 pps from Q1. In particular, it rose 6.3% y/y, faster than in April and May. Real estate investment rose 10.3% y/y, down 1.5 pps from Q1. This could be an indicator of real estate investment growth turning downward. Retail sales of social consumption goods rose 6.5% y/y in real terms, down 0.4 pps from Q1 -- even though this incorporates the high June number -- due to automobile sales deregulation.
Exports in dollar terms fell -1.6% y/y, down 3 pps from Q1. Export is shifting to the European Union from the United States, because of the ongoing U.S.-China trade war. Exports to the EU rose 9.7% y/y, while exports to the U.S. fell -2.1% y/y, up 1.6 pps from Q1. Imports rose 2.3% y/y, up 1.9 pps from Q1.
CPI stopped appreciating. In June, CPI was up 2.7% y/y, the same rate as in May.
M2 was up 8% y/y at the end of June, down 0.3 pps from May. Although this growth has decreased just a bit, it has reached a new historical low. M1 rose 6.6% y/y, up 0.6 pps from May. Saving deposits rose 5.5% y/y, down 0.2 pps from May, and down 5.2 pps from June 2018.
President Jinping Xi announced, on June 28th at the G20 meeting at Osaka, that China would further open its market, proactively expand imports, continuously improve its business environment for foreign enterprises, and press ahead with negotiations on economic and trade deals. Just two days later, on June 30th, the National Development and Reform Commission and the Ministry of Commerce jointly issued two new “negative lists,” and one “encouraged catalogue,” both indicating improved terms for foreign investment. The number of items on the 2019 national FI [foreign investment] negative list was cut to 40 from 48, and to 37 on the FTZ list. The 2019 FI negative list further opens the services, agriculture, mining, and manufacturing sectors.
We expect China to open up more sectors, especially where the country lacks a strong comparative advantage, such as in services. By contrast, even though U.S. President Donald Trump promised, while meeting with Xi at the G20, that his administration wouldn’t’t levy more tariffs on Chinese goods, Trump’s record of keeping his word is not trustworthy -- to wit, July reports say he does want to add more tariffs. Yet economic globalization is very hard to reverse. Even Trump is realizing that restricting U.S. companies from working with Huawei would hurt U.S. companies’ exports to Huawei. This trade war may last for awhile -- but in the long run, globalization will prevail.


Growth is facing downward pressure. Industrial output rose 5% y/y, down 0.4 pps from April, reaching a new low rate. Investment rose 4.4% y/y, down 1.3 pps from April. The decrease of investment growth rate is mainly affected by state investment because of fiscal deficit pressure. State investment rose 5.6% y/y in May, down 4.2 pps from April. In May, fiscal revenue fell -2.1% y/y, down 7.4 pps from January-April, putting further constraint on state investment. Real estate cooled further.
Retail sales of social consumption goods were up 8.6% y/y in May in nominal terms. The adjusted growth rate was 7.9% y/y, down 0.4 pps from Q1. The adjusted real consumption rose 5.7% y/y, down 1.2 pps from Q1. Trump’s trade war is still ongoing. Even the current negotiation positive sign cannot be taken seriously as he likes to and repeatedly played uncertainty card. Overall, trade was very volatile. In May, the smoothed export growth rate was 5.5% y/y, down 1.2 pps from Q1, down 4 pps from last Q4. The smoothed import growth rate was around 1% y/y, down 8.5 pps from last Q4.
After main financial indicators had large drops in April, they are relatively stable in May. In the end of May, M2 rose 8.5% y/y, comparable to April. M1 rose 3.4% y/y, up 0.5 pps from April.
London-Shanghai connect was initiated on June 17th and foreign companies can list their shares in mainland China for the first time. These will enable firms listed in the UK and mainland China to raise funds on each other’s stock market. This is a continuation of effort in more financial openness, in line with the easing of restrictions on foreign fund manager outflows from China, Beijing on June 12, 2018 lifted the monthly cap of 20 percent on the outflows that investors want to take out China via QFII scheme. More financial openness is consistent with China’s overall policy line in contrast to Trump’s trade protectionism. We expect financial openness will improve China’s capital usage efficiency. We do believe that foreign investors, particularly the professional institutional investors will flow more into China compared to the other way around.
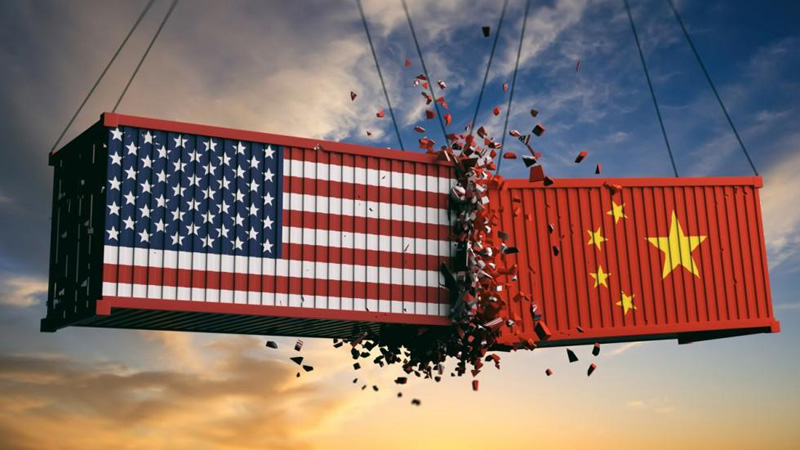
 Almost all major economic indicators are falling. Industrial output was up 5.4% y/y, back to its low January-February level, after its March rise. Fixed asset investment was up 5.7% y/y in April, down 0.6 pps from Q1.
Retail sales of social consumption goods were up 7.2% y/y in nominal terms, reaching their lowest growth rates in recent years, down 1.1 pps from Q1. Real sales growth was up 5.1% y/y, down 1.8 pps from Q1.
CPI was up 2.5% y/y in April, a rise of 0.2 pps from March. Monetary loosening has seemed to stop. In April, the societal financing scale turned to negative growth, after its quick uptick in Q1; this led principal financial indicators to fall. At the end of April, the M2 money supply was up 8.5% y/y, down 0.1 pps from March.
National budget revenue was up 2.8% y/y, down 3.4 pps from Q1, with spending up 15.9% y/y, up 0.9 pps from Q1. Such a large budget deficit is historically very rare, happening only in 1990 and 1995, when it constrained future fiscal expansion.
Exports in April were up 3.1% y/y, down 3.6 pps from Q1, and down 6.4 pps from Q4 2018. Imports were up 10.3% y/y, and up 9.9 pps from Q1. In April, trade with the United States worsened further. Exports to the United States fell -7.9% y/y, down 4.2 pps from Q1, while imports fell -21.4% y/y, down 1.9 pps.
The U.S.-China trade war is escalating. On May 5th, U.S. President Donald Trump said previous U.S. tariffs of 10% levied against $200 billion worth of Chinese goods would be raised to 25% on May 10th. China announced it would raise tariffs on $60 billion worth of U.S. goods. On May 21st, following pressure from the U.S. government, Google suspended Huawei's access to Google services and apps, to reduce Huawei’s competitiveness.
Trade war is hurting both China and the United States, and global trade as well. The uncertainty generated by trade war has reduced investment in China – or has at least made many investors delay their projects, since last year. Negative market sentiment can be seen from the major stock market drop. This also hurts technological advancement, although it’s hard to hinder technology spillover amid today’s fast and transparent information flow. On April 2nd, the WTO trimmed its 2019 global trade growth forecast to 2.6%, from 3.7%. Countries on the global supply chain are suffering. Singapore, for example, which relies heavily upon the global supply chain, saw its economic growth drop to decade low, of 1.2% GDP growth in Q1. A global slowdown would in turn hurt both China and the United States.
 The Chinese economy began to rebound in Q1, with GDP up 6.4% y/y, flat on Q4 2018. Industrial output was up 6.5% y/y, up 0.8 pps from Q4. Then in March, GDP rose a powerful 8.5% y/y, up 1.4 pps from Q4, to its fastest growth rate since August 2014.
Investment, up 6.3% y/y, showed no clear trend. State investment was up 6.7% y/y, up 8.3 pps from Q3 2018, signaling government’s intention to keep supporting the economy.
Retail sales of consumption goods was up 8.3% y/y in Q1 in nominal terms, flat on Q4. Sales’ real growth rate was 6.9% y/y, up 0.9 pps.
Exports were up 6.7% y/y, down 1.8 pps, while imports rose 0.3% y/y, down 9.2 pps. The net export impact on China’s GDP was positive.
In March, CPI was up 2.3% y/y, and up 0.8 pps from February. The ex-factory price index of industrial goods and PPI rose 0.4% and 0.2% y/y respectively, and the main financial indicators also rose. At the end of March, M2 was up 8.6% y/y, up 0.5 pps from the end of 2018. In a strong recovery, M1 rose 4.6% y/y, up 3.1 pps from the end of 2018. Savings deposits from non-financial institutions were up 7% y/y, up 3.2 pps from 2018.
The second Belt and Road Initiative Forum hosted 37 countries in Beijing during the week of April 24th, with eight more countries participating since the last forum two years ago, including two new EU countries, Austria and Portugal. The initiative and dialogue forum will enhance global economic cooperation. The recent nexus of economic and geopolitical friction, such as the Huawei conflict with the Canadian government, requires negotiations. In our view, the Chinese government not only uses policy instruments to smooth over domestic economic cycles, but also tries to calm the international business cycle, adding strategic international investment. This can be seen from the relatively stable exchange rates, in external accounts, and in FDI and ODI.

 Prime Minister Keqiang Li announced during his annual address to the People’s Congress of Beijing on March 5th that China’s growth target for 2019 would be in the 6% to 6.5% range. Another key takeaway is a significant 3 pps cut in value-added tax rate for manufacturers, to 13%.
Industrial output was up 5.3% y/y in January-February, a record low rise, and down 0.4 pps from Q4 2018. The slowdown was mainly caused by weakening auto industry output, and a plunge in exports. Fixed asset investment was up 6.1% y/y, down 1.4 pps from Q4, but 1.6 pps higher than the lowest rate seen in 2018, in Q3. It’s hard to conclude a clear trend for investment growth. Retail sales of consumer goods were up 7.1% y/y in real terms, up 1.1 pps from Q4. Trade dipped further. Exports were up only 0.1% y/y, down 10.2 pps from the fastest-growing rate, in Q3. Imports were up 1.5% y/y, down 17.5 pps from Q3, and have been sharply declining since November.
CPI rose 1.6% y/y in February, down 0.7 pps from its highest growth rate, in Q3 2018. We expect the CPI to fall further. For producer prices, the ex-factory price index of industrial products and PPI were up 0.1% and -0.1% y/y, down 4.6 pps and 5.3 pps from its fastest growth rate of 2018. In January-February, M1 rose 2% y/y, up 0.5 from the end of 2018, M2 was up 8% y/y. The total financing scale jumped 25% y/y, in contrast to -14.1% y/y in 2018, possibly to keep future money growth afloat.
On March 15th, at the end of its annual policy conference, Beijing passed a new foreign investment law, in which it promised to give foreign firms treatment equal to domestic firms. Government support will apply equally to foreign firms, and their applications for operating licenses won’t be treated differently from their domestic rivals, Beijing announced. Forced technology transfers will be banned. This policy demonstrates China’s commitment to continue opening, consistent with previous government claims. The equality law will compensate for the negativity from growth slowdown and trade war. We expect FDI, crucially built on investor confidence, might rise, though FDI has already been stable.
 GDP rose 6.6% y/y in 2018, down 0.2 pps from 2017. Growth rates declined each quarter throughout the year, falling from 6.8% y/y in Q1 to 6.4% y/y in Q4. Industrial output was up 6.2% y/y, down 0.4 pps from 2017. The manufacturing sector is the main reason for growth slowdown, and growth there fell from 7% y/y in Q1 to 5.7% y/y in Q4.
Consumption was up 9% y/y in nominal terms, and 7% y/y in real terms, down 1.2 and 1.9 pps from 2017, respectively. In 2018, exports were up 7.1% y/y, down 3.7 pps from 2017. Imports rose 12.9% y/y, down 5.8 pps from 2017. Exports slowed sharply at yearend, rising only 0.2% y/y in December. Imports also slowed, mainly in November and December, up 7.8% y/y and -3.1% y/y respectively. We believe trade war might be a main factor, even though net exports comprise a small share of Chinese GDP.
Producer prices fell in 2018, and are expected to fall further in 2019, in the current tightened monetary policy environment. The ex-factory price of industrial goods rose 3.5% y/y, and PPI rose 4.1% y/y, down 2.8 pps and 4 pps from 2017. CPI instead rose 2.1% y/y, up 0.5 pps from 2017, driven mostly by rising food and gas prices.
At the end of 2018, M1 rose 1.5% y/y, down 10.3 pps from the end of 2017. Savings deposits from non-financial enterprises fell -0.7% y/y, down 11.3 pps from the end of 2017. M2 rose 8.3% y/y, and down 0.4 pps from last year. The shadow banking sector, such as trusted loans, has shrunk, largely due to the effects of financial risk regulation. We believe the Chinese government is mainly using fiscal instruments to boost growth, and that monetary policy won’t change much in 2019.
Investment was up 5.9% y/y in 2018, and up 0.5% y/y in real terms, down 1.3 pps and 0.8 pps, respectively, from 2017. However, in Q4 investment rose, and was up 7.5% y/y, up 3 pps from Q3. In response to December’s annual Central Economic Work Conference plan to increase fiscal support, the State Council approved a 2019 quota for new local government bond issuances of 1.39 trillion yuan, enabling local authorities to start issuing debt from January, ahead of the usual schedule. Moreover, externally, FDI rose 3% in 2018, to $135 billion. Commerce Minister Zhong Shan stated on January 13th that China would reduce restrictions on foreign investment, and address difficulties facing foreign companies investing in China. The investment boost is necessary, as the current slowdown is mainly due to the uncertain global geopolitical environment. We also expect capital allocation efficiency to be enhanced, after the intensive anti-corruption campaign running since 2013.

 Top leaders’ annual Central Economic Work Conference, held from December 19th to 21st, set countering the ongoing growth downturn as its main 2019 goal for the economy. Leaders pledged to cut taxes and fees “on a greater scale;” to increase the issuance of local government bonds by “a relatively large margin;” and to strike a balance between monetary tightening and easing, to ensure “reasonably ample liquidity.” They promised to continue to address the financing difficulties of private and small companies. Such measures are part of official efforts to “strengthen counter-cyclical policy adjustments,” a statement that refers to government support for boosting economic growth, according to statements by the Xinhua News Agency.
Growth slowed further in November. Industrial output was up 5.4% y/y, down 0.6 pps from Q3, and down 0.7 pps from November 2017, to its lowest level since this cycle of economic downturn began. Fixed asset investment was up 7.7% y/y, comparable to October, driven mostly by state investment, with an increase of 6.7% y/y, up 12.5 pps from July.
Consumption and trade dipped further. Retail sales of consumer goods were up 8.1% y/y in nominal terms in November, down 0.9 pps from Q3. Their real growth rate was 5.8% y/y, down 0.7 pps from Q3. Both exports and imports experienced a major growth slowdown. Exports were up 10.2% y/y, down 9.9 pps from October. Imports rose 7.8% y/y, down 18.5 pps from October. We expect trade to deteriorate further, due to the trade war with the United States.
Prices are declining, likely due to the low money supply. In November, CPI rose 2.2% y/y, down 0.3 pps from October. The ex-factory price of industrial goods rose 2.7% y/y, down 0.6 from October. At the end of November, M2 rose 8% y/y, the same rate as in October. M1 rose 1.5% y/y, down 1.2 pps from October, reaching repeated record lows.
China’s auto sales fell -18% y/y in November, and have been plunging since June, marking the first annual negative growth in three decades. As the world’s largest auto market, 29 million cars were purchased in China last year, compared to 19 million in the second largest car market, the United States. Although peer analysts consider the fall in Chinese car sales the result of the 2018 elimination of the auto sale tax rebate policy, we view the main reasons as economic slowdown, a crowding out from the housing boom and strict regulation of the shadow banking sector for consumer loans. But we also view auto sales decline as a short-term phenomenon, as housing prices have already shown declining trends from earlier overshooting.

 Growth was stable but a bit lower in October. Industrial output was up 5.9% y/y, up only by 0.1 pps from September. Investment rose 8% y/y, having been rising for three consecutive months, and up 5 pps compared to the lowest rate in July. State investment is accelerated to counteract other negative growth factors.
Retail sales of consumer goods were up 8.6% y/y in nominal terms in October, down 0.4 pps from Q3, only up 0.1 pps from the lowest rate in May. Its real growth rate was 6.5% y/y, down 0.9 pps from Q3, reaching the lowest rate since this cycle of economic slowdown.
Despite of trade war, trade is booming. Exports rose 20.1% y/y, up 9.8 pps from Q3. Imports rose 26.3% y/y, up 7.3 pps from Q3. Trade surplus to the US widened in particular, possibly thanks to the strong dollar, reached 218.1 billion yuan in October, and rose 23.9% y/y.
Prices growth is expected to go downwards with the current non-loosened monetary policy. In October, CPI rose 2.5% y/y, same rate as September. The ex-factory price index of industrial outputs and PPI grew 3.3% and 4% y/y, down 0.3 and 0.2 pps from September respectively.
In the end of October, M2 was up 8% y/y, down 0.3 pps from September. M1 rose 2.7% y/y, down 1.3 pps from September, reaching new low since this downturn cycle, having already been lower than the bottom in last cycle in March 2015. However, the trend is still fast declining. Central bank has the incentive not to lower interest rate to keep RMB afloat.
Infrastructure investment growth rate had its first rise in October this year. In particular, it rose 3.7% y/y, up 0.4 pps from September. This has been shown in recent intensive announcements for new openings and approvals of mega-projects, such as speed railway. Chinese government’s relative low public debt at 47.6% of GDP with its international peers made such investment possible and sustainable for a while. Stronger monitoring by central government over local government spending may improve infrastructure investment efficiency. The low central government debt also makes tax reduction possible, as it has announced on November 1st to reduce value added tax rate for private firms, SMEs, and high-tech companies. Both infrastructure investment and tax cut will generate future growth, and the former will have a boost to the economy even in a short term.
 Growth slowed in Q3, though it remained in a stable zone, with GDP expanding 6.5% y/y, down 0.3 pps from H1. Though the most uncertain factor is the U.S.-China trade war, trade is booming: in Q3, exports were up 10.3% y/y, and up 7 pps from Q2. Imports were up 19% y/y, up 8 pps from Q2. Trade also comprises a very small share of Chinese GDP, and we are still optimistic that H2 growth will be stable.
Industrial output was up 6% y/y in Q3, down 0.7 pps from H1. Moreover, it rose 5.8% y/y in September, close to a historical low. Fixed asset investment was up 4.5% y/y, down 0.7 pps from Q2, and down -0.9% y/y in real terms. However, for different months, investment growth rates show promising increasing patterns. In particular, investment rose 4.1% y/y in August, up 1.1 pps from July. It increased further, by 6% y/y, in September. But it’s still early to forecast that investment growth is turning firmly upward.
Consumption is stable. Retail sales of social consumption goods were up 9% y/y in nominal terms, the same rate as in Q2, and up 6.5% y/y in real terms, down 0.8 pps from Q2.
CPI was up 2.5% y/y in September, after rising for four consecutive months, and up 0.7 pps from May. CPI growth reached a new high since 2014, if we exempt the Spring Festival (New Year) season. The ex-factory price index of industrial products and PPI rose 3.6% and 4.2% y/y, down 0.5 and 0.6 pps from August respectively. However, both CPI and producer prices are expected to have growth limits, due to still-low money supply. In particular, M2 was up 8.2% y/y, basically stable since March. M1 was up 4% y/y, and has not shown signs of rebounding since the big 1.2 pps drop in August.
Despite the trade war between the United States and China, China overtook the United States to become top spot for foreign direct investment globally in H1 2018, with investment up 6% y/y to $70 billion. On October 17th, Bridgewater Associates, the world’s largest hedge fund, registered its first private securities fund in China. Its chief investment officer talks about shifting investment to Asia, and to China in particular. Based on these data, and on anecdotal information, we still have confidence in China. Investors, whether in the financial or real sectors, cannot ignore China’s three key advantages: world-class infrastructure, an educated and still-cheap labor force and most of all, the country’s scale: China is potentially the world’s largest market.

 Growth is still stable amid the uncertainty of trade war. Industrial output was up 6% y/y in July, the same rate as in June, and down 0.6 pps from Q2, still in a stable zone. Investment increased 3% y/y in July, down 2.2 pps from Q2, and down 3.8 pps from July 2017, showing a stark decline. But private investment is in much better shape than state investment. The current investment slowdown might be related to financial deleveraging in both the state enterprise sector and in local governments.
Retail sales of consumer goods were up 6.5% y/y, down 0.8 pps from Q2. The previous housing boom might have crowded out consumption. Despite the U.S.-China trade war, total exports grew 6% y/y, up 2.7 pps from Q2. In particular, exports to the United States were up 6% y/y, up 2.7 pps from Q2, and showed no signs of declining. We expect exports to the United States, at least, won’t decrease too much in future, given the currently weaker yuan. Adjusted imports rose 13.3% y/y, comparable to the rates of recent months.
CPI was up 2.1% y/y in July, up only 0.3 pps from the previous two months. In July, ex-factory production prices were up 4.6% y/y, down 0.1 pps from June. PPI rose 5.2% y/y, up 0.1 pps from June. Tightened monetary policy is on track to return to normal. At the end of July, the M2 money supply was up 8.5% y/y, and up 0.5 pps from June, and is possibly an indicator for an end to monetary policy tightening.
Currency fluctuation and financial risks have been frequently mentioned in the news headlines of late. Yuan depreciation, from 6.3 yuan per dollar at the beginning of this year to 6.87 on August 24th, has attracted a great deal of attention. Meanwhile, there have been reports of incidents of P2P lending bankruptcy, which even caused some investors to protest in their local financial districts. Of course, these are potential risks to the economy and to the financial system in particular. But we believe the risks can be contained by China’s sound fundamentals. Currency depreciation is strongly linked to an overall stronger dollar index, as seen from their strong correlation in our data graph. A Turkish lira-style collapse of the yuan is unlikely. We expect the yuan to fluctuate around 7 against the dollar this year. P2P lending is now under much tighter regulation and, given its relatively small size in the total financial market, is hardly anything likely to cause a systemic crisis.
 GDP was up 6.8% y/y in H1, the same rate as in H2 2017. Industrial output was up 6.7% y/y, up 0.4 pps from H2 2017.
Fixed asset investment was up 6% y/y in H1, down 2.6 pps from H1 2017, and up only 0.3% y/y in real terms, down 3.5 pps from last H1. The major drop of state investment is likely the main cause. Possibly following the government’s deleverage reform to reduce financial risk, state investment rose only 3% y/y, down 9 pps from H1 2017. In H1 2018, retail sales of social consumption goods rose 9.4% y/y in nominal terms, and grew 7.7% y/y in real terms, down 1 and 1.4 pps from H1 2017.
CPI was very stable in H1. It rose 2.2% y/y in Q1, and 1.8% y/y in Q2, the same rate as in Q4 2017. In H1, growth rates for producer prices weakened in February-March but rebounded strongly in May-June. In June, the ex-factory price index of industrial goods rose 4.7% y/y, up 0.6 pps from May, and increased 0.3% m/m. PPI rose 5.1% y/y, up 0.8 pps from May, and increased 0.4% m/m. Tightening monetary policy puts constraints on prices’ future growth.
At the end of June, M2 was up 8% y/y, down 0.3 pps from May, and down 1.4 pps from last June. It reached a historically low new rate. Saving deposits rose 5.5% y/y, down 0.2 pps from May, and down 5.2 pps from last June. Stricter financial regulation is the main cause for cooling financial indicators.
Exports were up 4.9% y/y, down 10.1 pps from H1 2017. Imports were up 11.5% y/y, flat on H1 2017.
From April to June, the Chinese yuan depreciated against the dollar at monthly rates of 0.9%, 1.5%, and 3.5%. The yuan has been depreciating against other currencies at the same time, while the trade war with the United States intensifies. The latest episode was on July 20th, when U.S. President Donald Trump threatened to levy tariffs on every good imported from China, referring to the $505.5 billion in Chinese imports the U.S. took in last year. Trade and U.S.-China relationship uncertainty might explain the yuan’s depreciation. However, yuan depreciation may compensate partially for Chinese exports to the United States during the trade war. Moreover, depreciation can boost Chinese exports to other countries. With net exports taking only a small share of Chinese GDP, we don’t expect the trade war to negatively impact the Chinese economy much.
 Growth is facing downward pressure. Chinese fixed asset investment, a key growth driver, was up by a new low of just 3.9% y/y in May, and down 3.6 pps from Q1, as U.S. President Donald Trump announced that the United States would apply tariffs of 25% to roughly $50 billion worth of Chinese goods. A trade dispute between the world’s two largest economies will surely add uncertainty to the global market, and to Chinese domestic investment and economic growth as well. It’s still too early to measure the size of this impact, but we’d like to argue that trade’s direct effect on Chinese growth won’t be large, given trade’s small net share in Chinese GDP.
Value added for major industrial firms was up 6.8% y/y in May, slightly lower than in April. Retail sales of social consumption goods were up 8.5% y/y in nominal terms, and 6.9% y/y in real terms, the lowest rates since 1999. Imports grew much faster than exports. Exports rose 3.2% y/y, still on a declining trend since June 2017, and down 4 pps from Q1. Imports were up 15.6% y/y, and up 3.7 pps from Q1.
But M1 rose 6% y/y at the end of May, a new low, down 1.2 pps from April. This downward cycle of M1 growth started in August 2016, and has been continuing for 22 months, a situation mostly attributed to a new financial regulation to curb systemic risk. CPI growth, up 1.8% y/y, was flat. Producer prices rebounded powerfully, after three months of decline. The ex-factory price index of industrial goods was up 4.1% y/y, up 0.7 pps from April. PPI rose 4.3% y/y, up 0.6 pps from April. However, we expect producer price appreciation won’t be sustainable amid tightening monetary policy.
China’s integration with the rest of world shows no sign of slowing, the U.S.-China trade war notwithstanding. Chinese domestic investors made $47.89 billion in non-financial ODI in 2,987 overseas companies in 149 countries and regions between January and May, rising a robust 38.5% y/y. The rare decline of ODI growth in 2017 is mainly due to government regulations to curb financial risks, and financial extension of the anti-corruption campaign. The Belt and Road Initiative mainly invests in infrastructure. The economic return should be long term, and should also benefit China from a geopolitical strategy perspective. Countries disappointed in Trump’s retreat from globalization may also become more welcoming to China.
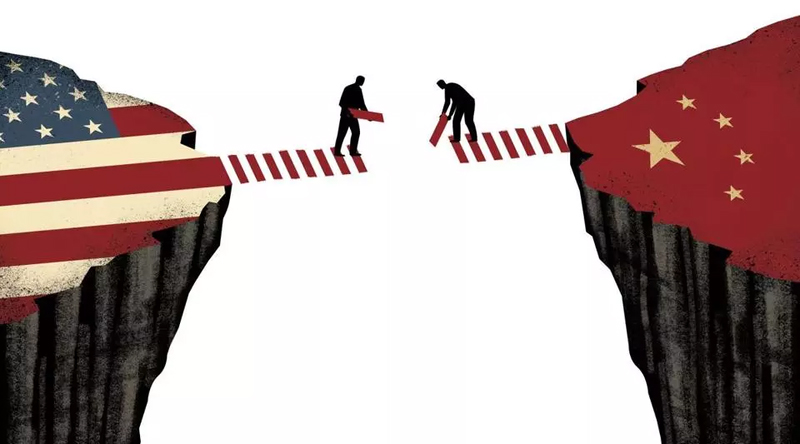
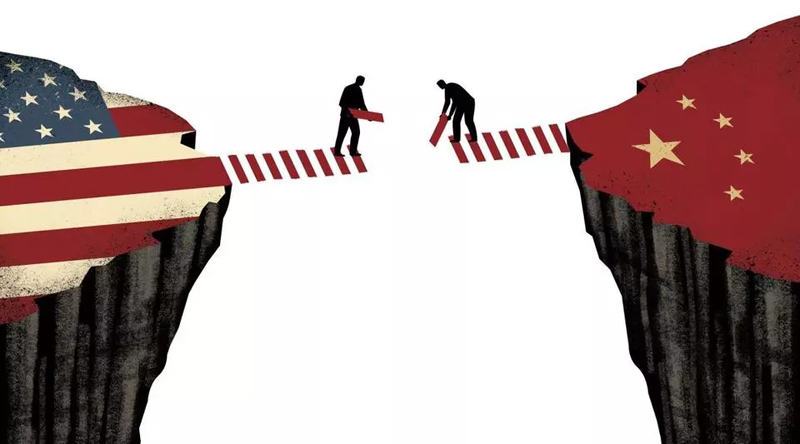 Growth data was mixed in April. The value added for industrial firms was up 7% y/y, up 0.2 pps from Q1 and up 0.8 pps from Q4 2017. Fixed asset investment was up 6.1% y/y, down 1.4 pps from Q1, although still higher than in Q3 2017. Specifically, private investment was up 7.5% y/y, down 1.4 pps from Q1, and state investment was up 5.4% y/y, down 1.7 pps from Q1.
Retail sales of social consumption goods climbed 9.4% y/y in April in nominal terms, down 0.4 pps from Q1. The real growth rate rose 7.9% y/y, down 0.2 pps from Q1. In April, exports were up 12.9% y/y, 1.2 pps lower than in Q1, though still high. The seasonally adjusted import growth rate is around 17% y/y. The fact that import growth exceeded export growth will help reduce global imbalance and sustain growth.
CPI was up 1.8% y/y in April, after falling for two consecutive months. We expect CPI this year will be like the trend in 2014, growing at stable rates. The fluctuation interval is between 1% and 2.5% y/y. Producer prices continue their slower growth trend, after growing powerfully for almost two years. The ex-factory price of industrial goods was up 3.4% y/y, and down -0.2% m/m. PPI rose 3.7% y/y, and fell -0.3% m/m.
Monetary policy is still tightening. At the end of April, M1 was up 7.2% y/y, and up just slightly -- by 0.1 pps -- from March. RMB savings deposits from non-financial enterprises were up 6.1% y/y, and up 0.8 pps from March. Both indices were mainly affected by large reductions last month, rather than signaling monetary policy loosening.
After high-level trade talks in Washington, the United States and China announced on May 21st that they would put their tariff increase threats on hold. This is very much consistent with our forecast last month that the trade war would be short-lived. We expect China to import more from the United States, as in the past, mostly in agriculture, high tech and services. This will reduce uncertainties in the global economy, and may boost investor confidence, as signaled the day after the announcement, when the S&P 500 rose 0.8%. Although the agreement would reduce China’s net exports, the impact on GDP would be negligible, as the trade share of GDP is much smaller than it once was. Use of imported high tech as capital goods in industries will certainly boost Chinese firms’ productivity. We view cooperation between China and the United States as a win-win solution for both countries, and for the world.

 Chinese economic growth was stable in Q1. GDP was up 6.8% y/y, flat on Q4. Industrial output was up 6.8% y/y, and up 0.6 pps from Q4.
Investment rose 7.5% y/y in Q1, up 1.7 pps from the lowest growth rate of 2017. However, the price-adjusted investment growth rate rose only 1.2% y/y. Assuredly, private investment recovered strongly, and rose 8.9% y/y, up 4.7 pps from Q3, reaching its highest rate since 2016. In Q1, real estate investment grew 10.4% y/y, up 6.3 pps from Q4 - its highest growth rate since 2015.
Retail sales of consumption goods were up 9.8% y/y in Q1 in nominal terms, and 8.1% y/y in real terms. Although both figures were only slightly lower than in Q4, these were among lowest growth rates since 2004.
Prices are declining, amid tightening monetary policy. CPI was up 2.1% y/y in March, down 0.1 pps from January-February. In March, producer price growth continued to fall rapidly. The ex-factory price index of industrial output was up 3.1% y/y, down 0.6 pps from February. This is the fifth consecutive decline. PPI was up 3.7% y/y, down 0.7 pps from February. Monetary policy is still tightening, and financial regulation is stricter, intended to reduce financial risk. In March, M1 rose 7.1% y/y, down 4.7 pps from the end of 2017, and down 11.7 pps from last March.
Though exports were up 14.1% y/y in Q1, up 4.9 pps from Q4 and up 8.5 pps from Q3, and imports were up 18.9% y/y, China and the United States are in a trade war. On March 22nd, U.S. President Donald J. Trump signed a memorandum to apply tariffs of $50 billion on Chinese goods. In a quick response, China raised its tariffs on 128 U.S. products, with implementation beginning on April 2nd. Both countries indicated that they plan to hike tariffs on the other’s exports far more.
The U.S.-China trade war may be short-lived. We believe that the United States has more to lose. The exit of U.S. firms from the Chinese outsourcing labor market will give its competitors a greater advantage in improving their balance sheets, and consequently in profit, R&D expenditure and TFP -- and in the end, more wins. Take the U.S.’s Apple vs. South Korea’s Samsung, for example. China’s large state capacity, as seen from the state sector’s sizable share of the economy and better government budget situation, will make growth both feasible and stable, as greater state capacity means better macro management ability. Too, the share of exports in Chinese GDP growth has declined steadily over the years.
 Prime Minister Keqiang Li announced during a March 5th address to the People’s Congress of Beijing that China’s growth target for 2018 would be about 6.5%, the same as in 2017, when growth reached 6.9%. The yuan will be “basically stable” at a reasonable level, Li also predicted. More local government debt will be cut, but not at the cost of infrastructure. Moreover, reducing financial risk will be key for the regulatory agency, an emphasis further confirmed by new Central Bank governor Gang Yi, who took office after Xiaochuan Zhou’s 13 years of service.
Only three days after the People’s Congress ended, U.S. President Donald Trump announced the plan to impose tariffs on $60 billion China’s exports to the United States. Such unilateral protectionist measures really pushed the Chinese economy, China-U.S. economic relations and the whole global trade system into great uncertainty, at least for the near future! Exports in January-February were up 24.4% y/y, a significant 15.2 pps rise from Q4 2017. Though export growth is generally rising, the current surge is still exceptional, and likely to be a short-term phenomenon. Imports were up 21.7% y/y, and the adjusted growth rate a still-flat rise of about 14.7% y/y.
Industrial output was up 7.2% y/y in January-February, up 1.1 pps from Q4, to a new post-2015 high. Fixed asset investment was up 7.9% y/y, up 1.5 pps from Q4, and up 2.1 pps from its nadir in Q3. Retail sales of consumer goods were up 9.7% y/y in nominal terms, down 0.2 pps from Q4, and up 7.9% y/y after considering the price factor, and down 0.5 pps from Q4. In February, the ex-factory price index of industrial products was up 3.7% y/y, a constantly falling growth rate, down 2.2 pps from Q4. PPI has demonstrated a similar trend. We expect producer price growth to fall further, given tightening monetary policy. CPI continued its slower rise, up 2.2% y/y in January-February, and up 0.4 pps from Q4. We expect CPI to rise by around 2.5% this year. M1 was up 11.7% y/y, and the adjusted rate is around 10% y/y, still falling from August 2016. M2 was up 8.7% y/y, less than almost every month in 2017.
Chinese politics has received much media attention this month. The first issue was the constitutional change of presidential term limits, with the elimination the two-term limit making it possible for President Jinping Xi to remain in his post after his second term. The second issue was the creation of new top positions and agencies, such as the National Supervision Commission, at the same political rank as the Justice Department, to battle corruption. We see policy continuity from this change of political arrangement, with deepening reform. We view centralization as favorable for breaking regional and uncoordinated barriers, such as pollution. And the continuing anti-corruption campaign will benefit the economy. At least for the short and medium term, we view China’s political arrangement as favorable to its growth.

 The ex-factory price index of industrial products was up 4.3% y/y in January, down 1.6 pps from Q4 2017. PPI was up 5.2% y/y, down 1.9 pps. Given tightening monetary policy, we expect producer prices will continue their downward trend in 2018. Due to the Spring Festival – the Chinese New Year -- many statistics are still unavailable. We can only analyze data from imports and exports, and on financial conditions and price levels. CPI was up 1.5% y/y in January or 2% y/y after correcting for the Spring Festival factor, slightly higher than in Q4. Similarly, with tightening monetary policy, a CPI increase at this high rate of 2% is not sustainable. Trade growth is within normal range, after adjusting for the holiday factor. Imports were up 36.9% y/y. This very high growth rate was instantly adjusted for the holiday effect to 13.2% y/y, in a normal range instead. Exports were up 9.7% y/y after the holiday adjustment, up 0.5 pps from last December. The M1 money supply was up 15% y/y at the end of January. Considering that the holidays came late this year, the adjusted M1 growth rate was even lower than in December. The general declining trend has not changed. M2 money supply was up 8.6% y/y, lower than almost all months in 2017. RMB loans from financial institutions were up 13.2% y/y. Savings deposits from non-financial enterprises were up 12.1% y/y. These two relatively high growth rates were the main ones affected by the holiday. In January, the societal financing scale fell -17.2% y/y. In particular, the increase outside of RMB loans fell -74% y/y, with a share of only 12.1%. These are immediate outcomes of recent financial regulation tightening, and of de-leveraging efforts.
Although China’s stock market has been hit by the recent huge volatility in the U.S. markets, China’s capital account seems to be shifting into balance. All of China’s external accounts turned to surplus in 2017, including the much worried-over FX reserve, adding $91.5 billion, from a $475.2 billion fall in 2016. The outside market is volatile, but Chinese growth is strong. The Chinese government is taking major steps to tackle any potential financial market disruption factors, as analyzed in detail in our recent reports. Based on these three factors, we expect in 2018 that the RMB-U.S. dollar exchange rate will be basically stable, that the capital account surplus will rise, and that foreign reserves will grow.

 Growth was robust and stable throughout 2017, even as fixed asset investment and consumption kept weakening. Exports rose, after two years of decline. Producer prices were elevated, while CPI showed little volatility. Monetary policy returned to moderately neutral levels, from its previous tight condition, and the money supply plunged.
GDP was up 6.9% for the year, and up 0.2 pps from 2016. Growth was consistent in quarterly terms, at 6.9% y/y in Q1 and Q2, and 6.8% y/y in Q3 and Q4. Value added for primary industry rose 3.9% in 2017, up 0.2 pps from 2016; manufacturing industry was up 6.1% y/y, flat on 2016; and services rose 8% y/y, up 0.2 pps. Industrial output rose 6.6% y/y, up 0.6 pps, though growth has been slowing. Fixed asset investment was up 7.2%, down 0.9 pps from 2016. After removing the price factor, investment was up 1.3% y/y, down 7.4 pps from 2016. Real estate sales turned from heating to cooling, the 19.5% y/y rise in Q1 falling to just 2.5% y/y by Q4, adding another factor in investment drop. Exports, conversely, picked up, rising 7.9% y/y, up 15.6 pps from 2016. Producer prices continued last year’s appreciation trend. The ex-factory price of industrial goods rose 6.3% y/y, and PPI rose 8.1% y/y. CPI rose 1.6% y/y, down 0.4 pps from 2016. The main financial indicators experienced major decreases. By the end of 2017, M2 rose 8.2% y/y, down 3.1 pps from 2016; M1 rose 11.8% y/y, down 9.6 pps from 2016.
This year begins with intensive financial regulations. On January 5th and 6th, China’s Bank Regulatory Commission issued three documents aimed at strengthening commercial bank regulation, related to trusted loans, bank equity and the too–big-to-fail mentality. These rules are responses to the central government’s main goal, set at the end of 2017 for 2018, to contain financial risks. On December 20th, the central government listed alleviating financial risk as one of the top three tasks facing central government. This again is a continuation of the central committee meeting about financial risk in mid-2017, led by President Xi Jinping.
We view the potential financial risks in China as containable, as the regulators have recognized the problems, and are determined to take serious steps to deal with them. Shadow banking as part of financial liberalization requires prudential regulation. The Chinese government has the capability, and the advantage of designing regulation by absorbing the lessons of U.S. 2008 subprime mortgage crisis.

 Growth remained stable in November, with industrial output up 6.1% y/y. Fixed asset investment excluding agriculture was up 6.3% y/y, up 0.5 pps from October, and up 2.4 pps from its August nadir. However, the current investment growth rate is still lower than investment goods’ price growth rate, indicating that real investment growth is still negative, by -0.2% y/y.
National fiscal revenue fell -1.4% y/y, turning negative for the first time this year. Since current investment strength is mainly government driven, the fall of fiscal revenue will constrain a possible investment rebound. Retail sales of consumer goods were up 10.2% y/y in nominal terms in November, the same rate as in Q3. The consumption indicator is always very stable. The ex-factory price index of industrial output was up 5.8% y/y in November, and PPI was up 7.1% y/y, down 1.1 and 1.3 pps respectively from October, indicating that price appreciation since August represents only a temporary rebound.
M1 was up 12.7% y/y by the end of November, down 0.3 pps from the end of October, showing a consecutive downward trend. Deposits from non-financial enterprises rose 11.9% y/y, down 0.5 pps from the end of October. M2 rose 9.1% y/y, slightly higher than the lowest level, up 0.3 pps from the end of October, mainly affected by large increases from fiscal deposits and non-bank financial institution deposits.
Exports were up 12.3% y/y in November in dollar terms, and up 5.4 pps from October, outstripping the fastest growth rate of Q2. But we believe the fast export growth rate is likely an outlier.
Imports maintained their strong growth, up 17.7% y/y, and up 3.1 pps from Q3. Even conservatively speaking, we expect China to surpass the United States as the world’s largest importer in 2022. Consumption demand as a rising share of import increase will be a key opportunity for investors. This is part of the effort made by current Chinese leaders to further integrate with the rest of the world, and to curb China’s external imbalance, with such initiatives as the Road and Belt, and AIIB. China will also hold its first annual national “import expo” in 2018. By contrast, U.S. President Donald Trump seems to be moving in the opposite direction, most recently seen as threatening to withdraw foreign aid, simply because countries do not support his decision to recognize Jerusalem as Israel’s capital. Any withdrawal by the United States will give China room to expand its role in world trade.

 Growth was relatively stable in October. Industrial output was up 6.2% y/y, almost the same as in previous months. Yet key growth drivers weakened. Fixed asset investment was up 5.8% y/y, slightly above the nadir, but lower than the investment price level. So real investment growth is still negative, a key challenge for the future.
Retail sales of consumer goods were up 10% y/y in nominal terms, and 8.6% y/y in real terms. Both were the weakest growth figures of the year. Exports were up 6.9% y/y, declining from Q1 and Q2. We expect exports to continue to slide. Furthermore, the growth rate of industrial export delivery value could dip below zero next year. Imports were up 17.2% y/y, maintaining their fast growth trend, up 2.6 pps from Q3.
Producer prices continue to appreciate. The ex-factory price index of industrial output was up 6.9% y/y, and PPI was up 8.4% y/y. They grew 0.7% and 0.9% m/m, respectively. Among the composition of industrial output prices, industrial processing prices were up 7.6% y/y, a new high.
CPI was up 1.9% y/y, a slight increase, though stable from previous months. By the end of October, M2 was up 8.8% y/y, a new low, reflecting a continuation of monetary tightening.
There have been three major changes to financial regulations. On November 10th, it was announced that the government would relax or eliminate ownership limits in commercial banking, securities, futures, asset management and insurance. The same day, a cabinet-level financial stability committee was established, putting financial stability in an unprecedentedly high position. On November 19th, the Central Bank, together with all other financial regulatory bodies, issued a new guideline to more strictly regulate the asset management businesses.
Financial openness can increase the efficiency of capital allocation domestically, and can further lift the real economy’s productivity, by at least increasing financial competition among financial institutions. The Chinese government has also learned from Western countries’ past financial crisis history, by making financial stability a higher priority, since openness and liberalization are usually accompanied by instability. We view this openness with a prudential regulatory approach as a very positive direction.
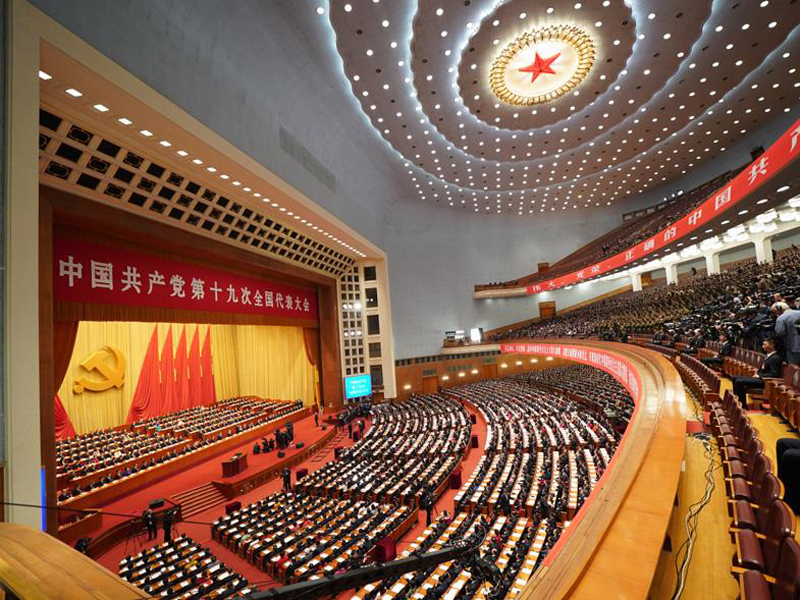
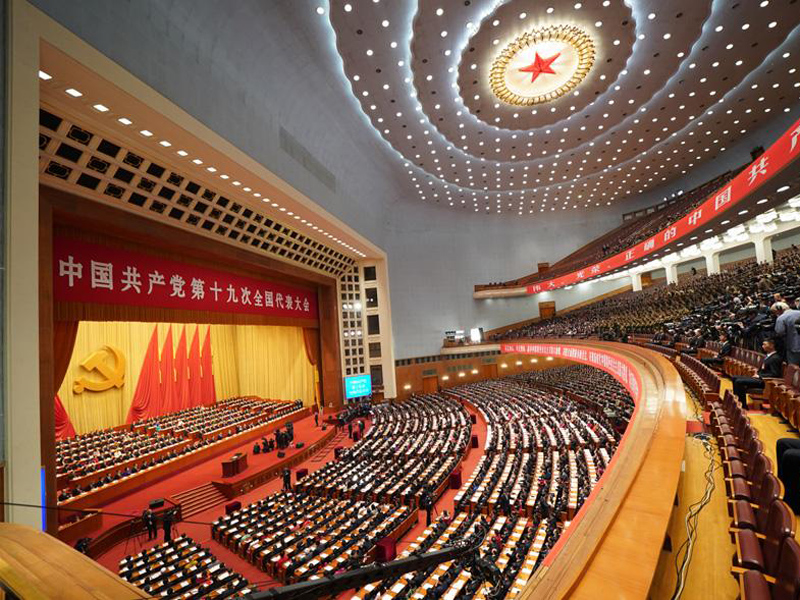 Growth in Q3 was stable, though slightly lower. GDP was up 6.8% y/y, down 0.1 pps from Q2. Industrial output rose 6.3% y/y, down 0.5 pps from Q2, but still higher than in Q3 2016. However, industrial output in real terms might be worse than official statistics indicate.
Since the beginning of 2017, fixed asset investment has been weakening. It rose 9.2% y/y in Q1, then fell to 8.3% y/y in Q2, and fell further to 5.8% y/y in Q3. After taking out the price factor, fixed asset investment fell -0.6% y/y, down 5.1 pps from Q1. But the good news is that paid-in investment funds rose by a relatively large 6.7% y/y. In Q3, the real estate market quickly cooled. The sales area grew only 1.2% y/y, down 12.8 pps from Q2. Sales revenue rose 3.9% y/y, down 15.4 pps from Q2.
Retail sales of social consumption goods were up 10.3% y/y in Q3 in nominal terms, and up 9.2% y/y in real terms, both down 0.5 pps from Q2. Total imports rose 14.6% y/y, flat on Q2, still a fast-growing trend. We expect imports will continue to rise. Exports rose 6.9% y/y, down 2.3 pps from Q2.
Producer prices continue to appreciate. The ex-factory price index of industrial products rose 6.9% y/y, up 1.4 pps from June. PPI rose 8.5% y/y, up 1.2 pps from June. At the end of September, the M2 money supply rose 9.2% y/y, down 0.2 pps from June. M1 rose 14% y/y, down 1 pps from June.
China’s Communist Party held its 19th National Congress this week, where it elected its new leadership and set its main policy themes for the next five years. President Xi Jinping will remain in his post, indicating a continuation of the current policy line. This announcement has significantly reduced policy uncertainty. In his report, Xi said the next five years’ main themes would be openness, entrepreneurship and resolving inequality.
Further openness is not only an extension of Belt and Road program, but also means further welcoming FDI and financial liberalization. These areas are viewed among economists as priorities for development. Entrepreneurship is for productivity growth, which is expected to be the key growth driver, rather than investment. Inequality is a primary issue for political stability in China. The government report specifically mentions IT. The extensive use of IT may have positive implications for the economy, as IT not only improves efficiency, but also may empower the central government. It can deliver sufficient information and monitoring ability for the conduct of government policy, and lead to better policy outcomes. We are positive on China’s future growth, given the government’s objectives -- but of course we need to watch closely, to see how these objectives will be implemented.
 Growth weakened in August. Industrial output was up 6% y/y, down 0.4 pps from July, and down 0.9 pps from Q2, which represented its lowest level of the year. Fixed asset investment, up 4.9%, was likewise at its lowest level of the year, down 3.4 pps from Q2.
But the ex-factory price index of industrial products rose 6.3% y/y, and was up 0.8 pps from July. PPI rose 7.7% y/y, up 0.7 pps from July. The producer price appreciation is hard to reconcile with weakening growth. We view economic fundamentals as sound, but macroeconomic uncertainty, especially driven by negative media reports, is slowing investment.
Retail sales of social consumption goods were up 8.9% y/y, down 0.7 pps from July, and down 0.8 pps from Q2. The weak retail sales can be partially explained by the crowding-out effect brought by booming housing prices. Exports were up 5.5% y/y, down 1.7 pps from July, and further down 3.7 pps from Q2. The RMB has appreciated against the dollar for four consecutive months since May, and was up more than 6%. Appreciation will negatively affect exports. Imports were up 13.2% y/y, down 0.7 pps from Q2, but will possibly increase further from RMB appreciation.
CPI was up 1.8% y/y, up 0.4 pps from July. Since we expect food price appreciation to increase further, CPI appreciation will continue as well. We expect CPI growth to exceed 2%, but be less than 2.5% y/y.
S&P Global Ratings on September 21st cut China’s sovereign credit rating for the first time since 1999, to A+ from AA-, citing the risks from soaring debt, and revised its outlook to stable from negative. We see this rating as overreaction, and misleading. Debt may not be a bad thing, especially when a country uses it to finance some long-term return projects, such as high-speed trains or urban subways, benefiting not only consumers but also firms, through market integration. We also agree with Chinese government officials’ response, that economic fundamentals are sound. Moreover, China’s external debt is small. All of these factors invalidate the claim of high risk.

 Growth remained generally stable in July. Industrial output was up 6.4% y/y, similar to previous months. But fixed asset investment, the key growth driver, climbed only 6.8% y/y in real terms, its lowest rate this year, and was down 1.5 pps from Q2. Its adjusted growth rate is less than 5%, which will pressure future growth.
Real estate investment was hit by real estate market cooling, and was up just 4.7% y/y in July, down 3.4 pps from Q2. Imports were up 11% y/yy, down 3.2 pps. Import growth may even turn negative next year. Exports were up 7.2% y/y, down 2 pps from Q2. Retail sales of consumer goods have historically been less volatile, and were up 9.6% y/y in real terms in July, same rate as in June. CPI was slightly lower, up 1.4% y/y. But there are strong signs that vegetable, egg and pork prices will rebound, and CPI may rise to 2%. Producer price rises continued to slow. In July, ex-factory production prices rose 5.5% y/y, while PPI rose 7% y/y, down 0.3 pps from June.
Monetary policy in July continued falling back toward normal levels. M2 was up 9.2% y/y, down 2.1 pps from the end of 2016. M1 rose 15.3% y/y. Financial institutions’ estimated shadow banking investment increased 8.65 trillion yuan in 2016 alone, but decreased 845 billion yuan in Q2.
The National Financial Work Conference in July singled out prevention of financial risks as a top priority, including risks from outgoing investment. Chinese overseas M&A has often made major newspaper headlines in recent years, especially in 2016. After an August 18th session of the conference, the State Council gave detailed instructions about sectors where direct investment should be more restricted, and encouraged Chinese companies with M&A linked to real estate, hotels and entertainment, to be more cautious. This may reduce or even stop currently highly-leveraged corporations from investing. This initiative shows the government’s determination to rein in risk, and should prevent systemic financial risk.

 GDP rose 6.9% y/y in H1, up only 0.1 pps from Q4 2016. Industrial output rose 6.9% y/y, up 0.8 pps, and fixed asset investment rose 8.6%. But fixed asset investment’s real growth rate was just 3.8% y/y, down 5 pps from last year. Negatively affected by weak investment growth, we expect H2 growth to experience downward pressure. National household consumption spending rose 6.1% y/y, down 0.5 pps from H1 2016, reaching its lowest level since the creation of this measure in 2014. Retail sales of consumption goods rose 9.1% y/y in real terms, down 0.6 pps. Exports and imports are recovering, rising 8.5% and 18.9% y/y respectively, though both are still lower than in 2013 and 2014, and have much room for recovery.
The ex-factory price index of industrial goods peaked in February, with a growth rate of 7.8% y/y, and then declined, to 5.5% y/y in June. Similarly, PPI topped out in March, with growth of 10% y/y, falling to 7.3% y/y in June. We expect prices to be low in H2, based on the current non-loosening monetary policy.
In H1, negatively affected by financial deleveraging policies, the main financial indicators point mostly to persistent falling growth. At the end of June, M2 rose 9.4% y/y, down 1.9 pps from the end of 2016, reaching a historical low. M1 rose 15% y/y, down dramatically from recent high levels, and down 6.4 pps from the end of 2016.
National government revenue and expenditure rose 9.8% and 15.8% y/y respectively, generating a fiscal deficit of 918 billion CNY, 2.5 times that of H1 2016, constraining further fiscal expansion.
China’s top leaders have gathered every five years since 1997 for a National Financial Work Conference. On July 16th, during this meeting, financial risk was the main topic. The most concrete decision to emerge from the meeting so far has been President Xi Jinping’s announcement of the creation of a cabinet-level committee to coordinate financial oversight. We consider China’s financial or debt risk containable. Compared with the United States before the 2008 financial crisis, the Chinese government has at least recognized its debt risk. High debt, in contrast to other countries, mostly concentrates on the corporate sector – on state-owned enterprises in particular. The Chinese government has a large direct say in SOE debt restructuring. The centralization of financial oversight agencies can help avoid regulators’ coordination failure, and regulatory capture. China’s relative high economic growth also promises to contain its debt over the medium term.


Growth is relatively stable but still facing downward pressure. The value added for major industrial firms up 6.5% y/y in May – flat on April, and slightly below that of Q1, but still higher than all quarters of 2016. But as the key to growth, fixed asset investment was up 7.9% y/y, decreased 1.3 pps from Q1 after showing decreased trend for two consecutive months. Although current investment growth is not at its lowest rate, the adjusted rate below all quarters of last year after factoring in last year’s low base number. We therefore expect some pressure on future aggregate growth.
M2 reached a record low in May. It rose 9.6% y/y, down 0.9 pps from April, and down 2.2 pps from last May. This is partially due to the deleveraging efforts by monetary policy makers, but it certainly will put pressure on growth. Retail sales of consumption goods were up 10.7% y/y in nominal terms, flat on April. In May, exports grew 8.7% y/y, up 0.7 pps from Q1. Imports rose 14.8% y/y, down 9.8 pps from Q1. Over the medium term, as growth rates for producer prices turn downward, imports will continue to weaken, and might even consequently lead an export slowdown.
CPI was up 1.5% y/y in May, appreciating for three consecutive months, and up 0.3 pps from April. The ex-factory price index rose 5.5% y/y, down 0.9 pps from April. PPI rose 8% y/y, down 1 pps from April. The downward trends of producer prices confirm our previous forecast, and we expect this trend to continue.
The China Foreign Exchange Trade System trading platform, overseen by the Central Bank, announced the introduction of "counter-cyclical factor” into its calculation method of yuan's daily reference rate on May 26th. This will allow it to better reflect supply and demand over the long term, and to partially counter the short-term exchange rate fluctuations. We believe that this change will avoid currency herding, leading to a more fundamentals-based exchange rate. The change will increase the stability of yuan, reducing uncertainties for investors and trading partners. Meanwhile, the size of the FX reserve seems to be stabilizing in recent months, even under current environment while the new round of Fed interest rate hikes. It may be safe enough to expect much less volatility in the RMB exchange rate, at least for the rest of this year.


GDP was up 6.9% y/y in Q1, its fastest growth since last year, and up 0.1 pps from Q4 2016. However, given the end of producer price appreciation, and real estate market re-tightening, we expect this recovery to be temporary.
Industrial output rose 6.8% y/y, up 0.7 pps from Q4. March saw a particularly strong spike, up 7.6% y/y, its highest rate since 2015. Fixed asset investment rose 9.2% y/y, up 1.4 pps from Q4, when adjusted growth was only 4.5% y/y, after factoring in the Q1 investment price boom, down 1.9 pps.
Retail sales of consumption goods rose 10% y/y in Q1 in nominal terms, down 0.6 pps from Q4. The real term growth rate was 8.8% y/y in Q1, down 0.3 pps. Trade is balancing in Q1, with the trade surplus falling -47.8% y/y, while exports grew 8.2% y/y. Imports grew 24% y/y, up 21.3 pps, mainly driven by producer price appreciation, reflected in the commodity goods imports climb.
CPI was up 0.9% y/y in March, down 1.2 pps from December 2016. The large drop came mainly in the food category. Food prices fell -4.4% y/y, down 6.8 pps from December. In March, the ex-factory price index for industrial goods rose 7.6% y/y, down 0.2 pps from February. PPI rose 10% y/y, up only 0.1 pps from February. These two m/m growth rates also show obvious declines. We expect both growth rates to decline further.
M1 and M2 were up 18.8% y/y and 10.6% y/y at the end of March, down 2.6 and 0.7 pps from last December respectively. Other major financial indicators are also weakening.
The CCP central committee and state council announced in an April 4th joint statement that they plan to build a massive new city outside Beijing. Xiong’an is to be “three times the size of New York, and aims to achieve the same importance as Shenzhen and Shanghai Pudong, the announcement said. Simultaneously, residential land availability in Beijing is to expand significantly. These two policies indicate that China’s new approach to controlling housing bubbles as people rush to big cities will be increasing land supply in large urban centers, and building satellite cities nearby, instead of prioritizing small-city development. We view this as a positive measure to alleviate housing price appreciation pressure, while dealing with excessive housing supply in small cities, more and more people are leaving as they migrate to large urban centers.

 On March 5th, Prime Minister Keqiang Li announced in an address to Congress that China was aiming for growth of about 6.5% for 2017 and CPI of about 3%. He also mentioned the government would continue to implement a proactive fiscal policy and to maintain a prudent neutral monetary policy, in particular, M2 growth rate targeting at 12% y/y for 2017.
Price inflations slowed down in January-February. CPI experienced a large fall, dragged down by falling food prices, and rose 1.7% y/y, down 0.5 pps from last Q4. Ex-factory price index of industrial products rose 7.8% y/y, PPI rose 9.9% y/y, down 1 and 1.1 pps from last December, lowering for two consecutive months. We view the CPI decrease to be transitory but producer prices will continue to grow slower than before under tightening monetary policy.
In January-February, industrial output increased 6.3% y/y, up 0.2 pps from last Q4. Fixed asset investment excluding agriculture rose 8.9% y/y, up 1.1 pps from last Q4, largely from higher producer prices. Retail sales of consumer goods rose 9.5% y/y in nominal terms in January-February, down 0.9 pps from last quarter, and rose 8.1% y/y in real terms, down 1.1 pps and 1 pps respectively from last quarter. Imports in January-February rose 26.4% y/y, up starkly 23.7 pps from last Q4. Imports from developed countries also surged, possibly reflecting Chinese consumers’ higher quality demands. Exports were stabile as usual, growing at around 4% y/y.
In February, monetary policy continued its tightening. M1 rose 21.4% y/y, and grew around 20% y/y after canceling the Spring Festival effect, 1.4 pps lower than last December. M2 rose 11.1% y/y, down 0.2 pps from last December. Market interest rate increased. For example, the interbank deposits from AAA rated banks with maturity of one year had a return of 3.01% on November 1st, 2016, but rose to 4.18% in this March, up more 1 pps. The heightened market interest rate has negative effects on corporate financing. Net financing from corporate bond grew negatively for three consecutive months.
According to National Bureau of Statistics, real estate prices in China’s major cities rose around 50% y/y in the year of 2016. Property sales by area still rose 25.1% y/y in January-February. Local governments are now taking further steps to stabilize housing market by strengthening their cities’ housing purchase restrictions. We view there might be some corrections in China’s “first tier” large cities such as Beijing, Shanghai, and Shenzhen, but prices in second tier cities, mostly key provincial capitals, may remain to be sable, while small cities and towns in vast countryside (not those towns nearby large metropolitan areas) may continue to fall slightly in 2017. Our judgment is based on China’s sound GDP growth rate and top tier cities’ superior public goods provisions.

 Due to Chinese New Year, many statistics are still not available, making our analytical task more difficult. But one notable policy change is that monetary policy reversed its 2016 loosening trend, and shifted into tightening. We also expect this to be the trend for 2017. M1 rose 14.5% y/y, continuing the declining trend it began in August, decreasing 1 pps per month on average, and rising 20% y/y, after correcting for the New Year’s holiday effect. M2 rose 11.3% y/y, its lowest level since last year.
Loan growth has hit a new low. Chinese yuan loans from financial institutions rose 12.6% y/y, down 2.7 pps from last January, and their lowest growth rate since June 2005. Deposits from non-financial enterprises rose 11% y/y, showing a deleveraging trend since November. Imports jumped 16.7% y/y, and were up 14 pps from Q4 2016 in January, Exports improved less, rising 7.9% y/y.
CPI rose 2.5% y/y in January or 2.3% y/y after correcting for the New Year’s effect, slightly higher than last month. Producer prices continued rising. PPI rose a rapid 6.9% y/y, and 0.8% m/m, up 1.4 pps from last December. We expect PPI to match its last peak of 7.5% y/y, seen in July 2011.
The CEEM-PMI (an abbreviation for the China External Environment Monitor PMI), an external PMI indicator recently developed by the China Academy of Social Sciences, measures China’s external economic environment. It recently rose to 53.6, above the 50 threshold, mostly in line with, but better than, the two general PMI indices, NBS PMI and HSBC PMI, which were at 51.3 and 51 respectively. While the latter two figures indicate a general economic recovery for China, the CEEM-PMI signals possible improvement of external demand. The jump of the CEEM-PMI may be mainly driven by developed markets. For example, the new high value of U.S. PMI at 56 may be interpreted as a rebound from the previous overreaction to Trump-driven trade uncertainties.

 GDP in 2016 rose 6.7% y/y, down 0.2 pps from 2015, reaching the lowest yearly level in China. The quarterly growth was highly stable, with first three quarters rising 6.7% and the fourth quarter rising 6.8%. In 2016, fixed asset investment rose 8.1%, down 1.9 pps from 2015. From the growth trend, it rose fastest in Q1, and grew 10.7% y/y, higher than Q3 and Q4 in 2015. The other three quarters displayed slower growth rates.
Ended on December 16, 2016, the most important meeting, the central economic workshop meeting, held by Chinese top leaders including the President and Prime Minister, states that the policies for 2017 will lean towards fiscal policy rather than monetary policy which has been loosened but effect was small. The meeting also states that housing is for living, not for speculation. We expect the housing market will cool down further and more cities will start to adopt real estate tax to beat speculation.
There was divergence between imports and exports in 2016. Total exports fell -7.7% y/y, down 4.9 pps from 2015. Instead, total imports fell -5.5% y/y, up 8.6 pps from 2015.
Producer prices have been recovering. Ex-factory price of industrial goods first turned positive growth from September in 2016, and quickly expanded to 5.5% y/y growth rate in December. PPI turned positive from October and rose 6.3% y/y eventually in December. We expect the rising producer prices will translate to higher CPI in 2017. Before July, M1 growth rate steadily increased, reaching growth rate of 25.4% y/y at its peak, but after that, M1 growth rate lowered continuously, and grew 21.4% y/y in December, and the m/m growth rate was negative after considering seasonal factors. We expect monetary policy will be neutral in 2017.
On January 27, 2017, the US newly elected president Donald J Trump stated to consider a 20% tariff on Mexican exports to US. Trump has been an advocate for trade protection during his campaign. China is definitely on the list of potential tariff increase or to be labeled as currency manipulator. However, we expect US will lose more from a potential US-China trade war. Chinese economy is more flexible and can substitute jobs with its large fiscal capability considering China’s low national debt. China also mainly plays the role of processing trade which means the negative impact will transfer to other economies. The financial market will react instantly to any trade friction and self-fulling amid the two largest economies’ conflict, which will eventually lead to resort to US dollar safe haven. A large appreciation of US dollar will hurt the US economy more.

 The economic working meeting of the Communist Party Central Committee, chaired by President Xi Jinping, has set next year’s main economic goal: stability and progress. The meeting, which ended on December 16th, was the most important political-economic session of yearend. We view progress not in terms of the growth rate, but as focused on structural transformation, and aimed at a more balanced economy.
Fixed asset investment rose 8.3% y/y in real terms in November, up slightly after canceling for incomparable factors. For various industries, a key change is that industrial investment is picking up, rising 7.1% y/y in November, up 5.3 pps from Q3. Industrial output rose 6.2% y/y, up 0.1 from October, still in the stabilizing zone since April. State and state-controlled companies are diverging with private companies, by enjoying strong growth, up 7.5% y/y in October.
Retail sales of consumer goods in November recovered, rising 10.8% y/y in nominal terms. Both exports and imports jumped. Exports in dollar terms rose 0.1% y/y, up 6.4 pps from Q3. Imports rose 6.7% y/y, up 11.4 pps from Q3. Since trade is often volatile, this one-month jump cannot be interpreted as a rebounding trend.
Producer prices also rose significantly in November. The ex-factory price index of industrial output grew 1.5% m/m, and was up 3.3% y/y. PPI grew 1.8% m/m, and 3.5% y/y. CPI rose 2.3% y/y, continuously rising for several months. We expect rising producer prices to translate into higher inflation. The M1 money supply was up 22.7% y/y; its growth rate has been falling for four consecutive months, and is down 2.7 pps from July.
U.S. President-elect Donald Trump stated that, after taking office, he would list China as a currency manipulator. According to the three standards set by the U.S. Treasury department, China only meets one of these conditions, so China is very unlikely to be listed as a manipulator. But, given the large trade imbalance between the two countries, China needs to do more, such as to address the ongoing structural transformation, in addition to its currency actions, to balance its trade relations with the United States.
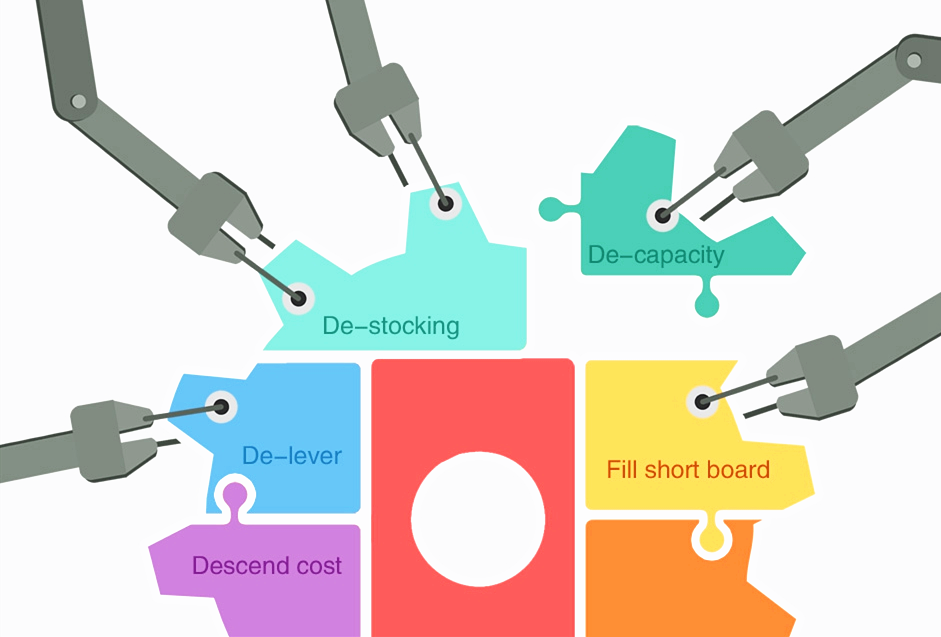
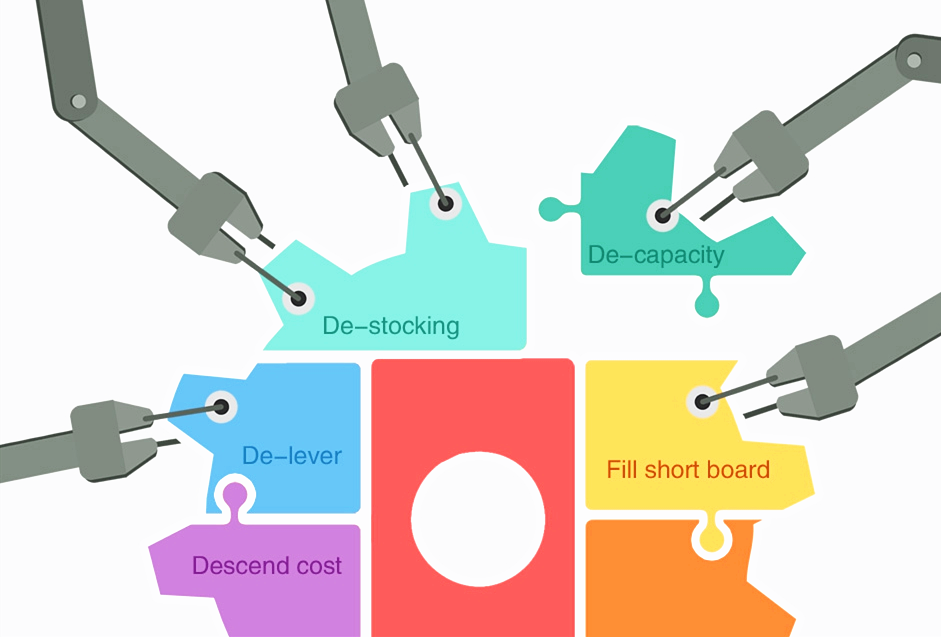 Key economic indicators are signaling positive changes. Fixed asset investment was up 8.1% y/y in August, and up 4.2 pps from July, recovering to Q2 levels, and halting its declining trend. Industrial output was up 6.3% y/y, and up 0.3 pps from July. Retail sales of social consumption goods were up 10.6% y/y in nominal terms, and up 0.4 pps from July. We attribute these positive signs to this year’s supply-side reforms, capacity cuts and deleveraging.
Exports fell -2.8% y/y, up 1.7 pps from Q2. Imports grew 1.5% y/y, shifting from negative into positive territory. The recovery trend for imports is firmer, and more certain.
CPI has been low for four months. In August, CPI was up 1.3% y/y, down 0.5 pps from July. We expect CPI growth to rebound, to around 1.5% y/y. Producer prices continue to recover, with negative numbers improving, rising closer to the zero line. The ex-factory price index of industrial products fell -0.8% y/y, and PPI fell -1.7% y/y, both up 0.9 pps.
Most financial indicators maintained their previous diverging trends. M1 grew 25.3% y/y, up 16 pps from August 2015. M2 rose 11.4% y/y, up 1.2 pps from July. Total loans from financial institutions were up 13% y/y – a declining trend, down 2.4 pps from August 2015.
Profits of China's major industrial firms rose 6.9% y/y in the first seven months of 2016, accelerating from H1’s 6.2% rise, according to the latest data released by the National Bureau of Statistics of China. Private firms in particular showed strong profit growth. We view this surprising profit increase, and other positive signals, as a consequence of cutting capacity and deleveraging. Those actions leave more room for the growth of private firms, since zombie firms (most of which are stated-owned) were taking up more resources, such as bank loans. We expect this supply-side reform to continue, and to generate more sustainable economic growth for China.

 The IMF in June raised its 2016 growth outlook for China to 6.6%, a 0.1 pp uptick from its April projection, even though Brexit prompted the Fund to slice its global growth forecast for 2016 by 0.1 pp, to 3.1%.
The growth upgrade for China shows that the IMF is optimistic about the major reforms underway in China. The Fund’s outlook is consistent with our forecast, as China still has plenty of room to lift its fixed asset investment and current structural reforms, including by deleveraging and cutting excessive capacity, which should generate sustainable growth. Other common media concerns, such as the increase in non-performing loans, the increase of government and household debt and yuan instability, are all mentioned. The Fund also notes that the Chinese government is fully aware of the problems, and is taking action to deal with them.
The bad news is that Chinese fixed asset investment was up just 3.9% y/y in real terms in July, down a significant 4.3 pps from Q2. We expect state investment to increase to counteract this declining trend, and to address the slowdown in private investment, since state investment complements private sector investment.
Industrial output was up 6% y/y, in a slight slowdown from Q2. Production and sales of automobile surged in Q2, by about 17%. Retail sales of consumer goods rose 10.2% y/y in nominal terms in July, flat on Q2. Exports fell -4.4% y/y, while imports fell -12.5% y/y, down 5.7 pps.
CPI rose 1.8% y/y, down for three consecutive months, and down 0.5 pps from April. Producer prices continue to recover. The ex-factory price index of industrial products fell -1.7% y/y, and PPI fell -2.6% y/y, down 0.9 and 0.8 pps from June.
Financial and monetary indicators showed divergent trends in July. M1 increased 25.4% y/y, up 0.8 pps from June, and up a significant 18.8 pps from July 2015. But other financial indicators failed to perform well. M2 rose 10.2% y/y, down 1.6 pps from June, and down 3.1 pps from 2015. Loans from financial institutions rose 12.9% y/y, down 1.4 pps from June, to their lowest level since 2006. The main reason behind this divergence is the inconsistency of monetary policy.

 GDP grew 6.7% y/y in Q2, the same rate as in Q1. There’s downward pressure on future growth, though we also expect growth to stabilize. Industrial output was up 6.1% y/y. Though growth was 0.3 pps faster than in Q1, the recovery is weak.
Fixed asset investment rose 8.2% y/y in real terms, down 2.5 pps from Q1, and at the end of June was up only 7.4% y/y. In particular, private investment was up just 1.4% y/y, down 4.3 pps from Q1, and even shrank -0.1% y/y in June.
Retail sales of consumer goods were up 10.6% y/y in June in nominal terms, and up 0.6 pps from May. In Q2, imports fell -6.8% y/y, up 6.7 pps from Q1. After taking out seasonal factors, imports have been recovering since March. Import recovery is not due to stronger demand, but to firms’ substitution of overseas goods, considering the increase of domestic producer goods’ prices due to continuing supply-side reform. Exports were down -4.6% y/y and, although up 5.1 pps from Q1, still face the risk of another dip.
CPI was up 1.8% y/y in June, decreasing for two consecutive months, down 0.4 pps from April. The declines are more related to seasonal factors, though. Producer prices are still in a recovery cycle. The ex-factory price index of industrial products in June fell -2.6% y/y, up 0.2 pps from May. PPI rose 0.2% m/m, and fell -3.4% y/y, trending up as well.
M1 and deposits from non-financial enterprises rose 24.6% y/y and 32.5% y/y in June, respectively, up 20.3 pps and 30.5 pps from June 2015. Such large increases amid a weak economy demonstrates the diminishing effect of monetary policy on the real economy. Supply-side reforms to eliminate excessive capacity leaves firms reluctant to invest, easy credit notwithstanding.
The results of the June 23rd Brexit referendum triggered a series of financial and economic consequences, such as the drop of pound sterling. If the UK leaves the EU, that would certainly diturb British trade with China, though it also creates an opportunity for China’s heated overseas enterprise expansion into the rest of the world. Pound depreciation will on the one hand put depreciation pressure on the yuan, considering the major roles of both in the currency basket, to which the yuan is pegging. On the other hand, the close relation between the United States and Europe will reduce the likelihood of the Fed hiking interest rates, given such high counterparty uncertainty. And that will reduce the prospects for yuan depreciation.

 Fixed asset investment growth slowed significantly in April, rising by 10.1% y/y, down 0.6 pps from Q1. Value added for major industrial firms was likewise weak, at 6% y/y, down 0.6 pps from March -- and a break from the previous recovery. We expect private investment to pick up after industrial output shows clear signs of rebound – rising above 10% y/y, for example. More actions need to be taken to boost growth, and the Chinese government is advocating structural reforms, by encouraging more innovation. But we hope China does not deviate too much from its old path of investment.
Retail sales of social consumption goods were up 10.1% y/y in nominal terms, down 0.2 pps from Q1. Exports in dollar terms fell -1.8% y/y, up 7.8 pps from Q1. Imports fell -10.9% y/y, 2.6 pps more than in Q1. Both indicators are still in the negative zone, though narrowing to the zero line. We do not expect trade to improve in the short term.
Prices are stabilizing, with CPI up 2.3% y/y in April, flat on March. In April, the ex-factory price index rose 0.7% m/m and fell -3.4% y/y. PPI rose 0.6% m/m and fell -4.4% y/y. The two indices’ y/y decreasing magnitudes fell by 0.9 and 0.8 pps, respectively.
M1 rose 22.9% y/y, up 0.8 pps from March, showing accelerated growth. But other major financial indicators are all declining. The broad money supply, M2, was up 12.8% y/y, down 0.6 pps from March. In April, total societal financing plunged by -28.9% y/y.
The People’s Bank of China made special announcements in response to the decline of financial indicators, emphasizing irregular factors underlying the drops. The Bank stressed that the general direction of monetary policy hasn’t, and wouldn’t, change.
China’s tax system underwent a major shift on May 1st, when the VAT system was extended to all sectors of the economy. Previously, firms paid tax based on their revenue; they’ll now enjoy a large tax reduction. We estimate that business taxes will fall by over RMB 300 billion. But the VAT reform will also generate enormous growth opportunities, especially for mid-sized firms that are mostly private, and will generate more jobs. The government budget won’t suffer, as VAT reform will attract more firms into business, and raise the output of existing firms – which will all increase government revenue.
 GDP rose 6.7% y/y in Q1. Although that is still slower than in Q4 2015, improved main indicators for growthbolster our confidence in future growth.
Industrial output rose 6.8% y/y in March, up 0.7 pps from the previousquarter. Fixed asset investment excluding agriculture rose 10.7% y/y in Q1, up 1.4 pps from Q4, and 11.1% y/y,with growth especially strong in March. In Q1, the real estate market heated up, and sales were up 33.1% y/y.
Retail sales of social consumption goods rose10.3% y/y in Q1 in nominal terms, up 0.1 pps from the previous quarter, and rose 10.5% y/y in March.
Exports in dollar terms fell -9.6% y/y in Q1, down 4.6 pps from Q4 2015. Imports fell -13.5% y/y, down 1.7 pps. However the monthly growth of exports in March was 18.7%, indicating a good possibility of further improvement.
In March, CPI rose 2.3% y/y, flat on February. One notable change was in industrial prices, which had been negative and falling for four years, but which turned upwards in March. The ex-factory price index rose 0.5% m/m, and PPI rose 0.3% m/m.
At the end of March, M1 rose 22.1% y/y, up a significant 6.9 pps from the end of 2015, and accelerating. M2 rose 13.4% y/y, which was quite stable. Savings deposits from non-financial enterprises rose 19.4% y/y, up 5.7 pps from the end of 2015 -- a major increase.

 Prime Minister Li Keqiang announced in an address to Congress on March 5th that the economic growth target would be 6.5%-7% for 2016 - the first time a GDP growth target was set for a particular time frame. Industrial output rose 5.4% y/y, a new low in the current cycle of decline. Fixed asset investment shows positive signs, and was up 10.2% y/y, up 0.9 pps from Q4 2015. State investment has increased, in order to lift growth. For example, planned total investment for new projects increased 41.1% y/y in January-February, giving us confidence in future growth.
Retail sales of consumer goods rose 10.2% y/y in nominal terms, down 0.9 pps from Q4. In February, CPI rose 2.3% y/y, up 0.7 pps from December. The ex-factory price index of industrial products fell -4.9% y/y, and PPI fell -6.5% y/y, finally narrowing the gap to zero, partly due to supply-side reform.
Trade fell further. Exports decreased -17.8% y/y in January-February, and are probably down around -10% y/y, after adjusting for last year’s large base number. Imports fell -16.7% y/y.
M1 was up 17.4% y/y at the end of February, up 1 pps from January, after factoring in the Chinese New Year effect. This shows that monetary policy is still loosening. Total loan size and societal financing scale have returned to normal levels.
Shenzhen, Beijing and Shanghai were in the headlines, as housing prices in first-tier cities have surged. Of particular note, housing prices in Shenzhen have risen more than 50% over the past year. Moreover, the real estate market recovered nationally. All this is contrary to the oft-heard pessimistic forecast in recent years, and is consistent with our previous forecasts.
Buyers’ strong expectations are based on their 10% per year increasing income. China still has probably the world’s strictest housing purchase entry regulations. The housing price surge is not surprising any more, viewed in light of the biggest rural-to-urban migration in human history, and the migration between cities (big cities are seen as more attractive, because of better public resources and job prospects). We do not rule out the risks of empty towns, but these mainly exist around a very limited number of small cities, and their systemic risk is quite low. We are still confident about China’s housing market, as long as the Chinese economy is growing at a moderate rate.